


 Top Rated Course

We may not have the course you’re looking for. If you enquire or give us a call on +44 1344 203 999 and speak to our training experts, we may still be able to help with your training requirements.
What is the S-Curve in Project Management?
Eliza Taylor 19 November 2024This blog on "What is the S-Curve in Project Management" offers an in-depth exploration of the S-Curve, a crucial tool in Project Management. This blog covers its definition, creation methods, various types, and practical applications for Project Managers, culminating in a comprehensive conclusion. Continue reading to learn more!

Training Outcomes Within Your Budget!
We ensure quality, budget-alignment, and timely delivery by our expert instructors.
Table of Contents

Project Management not only ends with initiating the projects successfully but also looks into the way they are carried out during their lifecycle. A deep insight into how the projects perform provides an idea about their success and failure. But how can the Project Managers gain deep insights into a project’s operations? This is where the S-Curve comes in.
It is a visual tool devised to help Project Managers make proper decisions according to the needs of the project. This S-Curve helps identify the areas where the project is lagging or improving or may even require some changes to obtain the desired outputs.
However, if you haven’t already started to utilise this tool, it’s time to learn. Read this blog to learn about what an S-Curve is and its types. Also, explore why it is used in Project Management and how it helps Project Managers.
Table of Contents
1) What is an S-Curve?
2) What are the types of S-Curves in Project Management?
3) Reasons to use an S-Curve in Project Management
4) How to create an S-Curve?
5) Understanding the Lines in an S-Curve
6) Conclusion
What is an S-Curve?
The S-Curve in Project Management is a mathematical graph that plots the data collected from the projects, such as cost incurred against time. This S-Curve in Project Management is mainly used to track the progress of the projects, the budget, and the time required to complete the projects.
The Curve gets its name from its shape, which resembles the alphabet “S”. At the beginning of the project, the progress is quite slow. It takes a bit of time to get into the flow of the project. Hence, when it is plotted on a graph, it shows a straight line. As the project gains momentum with time, the line gets sharper and moves upwards.
The Curve moves upwards according to the phases the project goes through over time. There are three major phases of the S-Curve in Project Management. They are as follows:
a) Initial phase
b) Immediate phase
c) Final phase

What are the types of S-Curves in Project Management?
S-Curves in Project Management can be of different types according to different project requirements. These types are as follows:
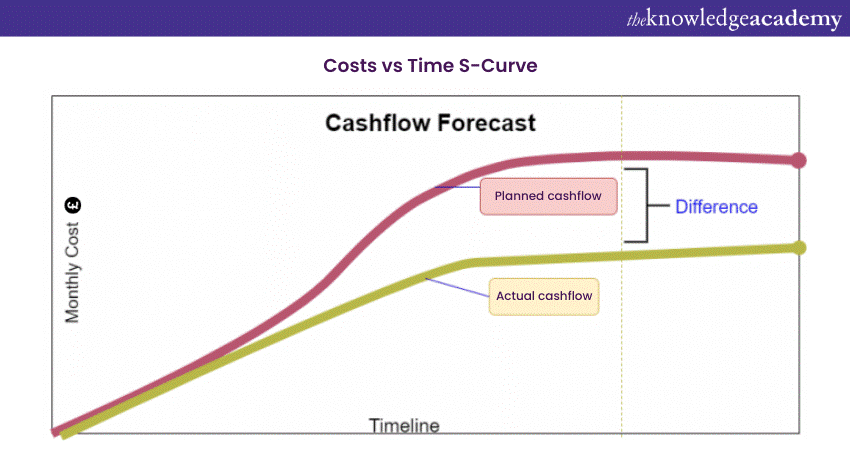
Costs vs Time S-Curve
This type of S-Curve is used in projects where both laborious and non-laborious tasks are of priority. This Curve helps the Project Managers understand the cumulative costs that are expended throughout the duration of the project. This Curve also shows the total cash flow of the project and the amount of capital required to complete it. Here's what this graph looks like:
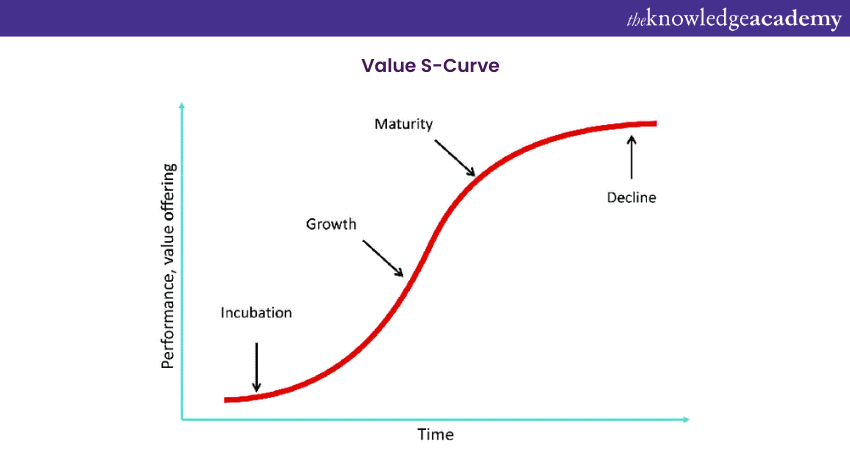
Value and Percentage S-Curve
Value S-Curvs give the Project Managers a visual representation of the man-hours or costs that are invested in a project and the amount of money that is required to complete that project. Percentage Curve, on the other hand, shows the Project Managers a distinct comparison between the completed project and the planned completion of the project. Here's a visual representation of the Value S-Curve:
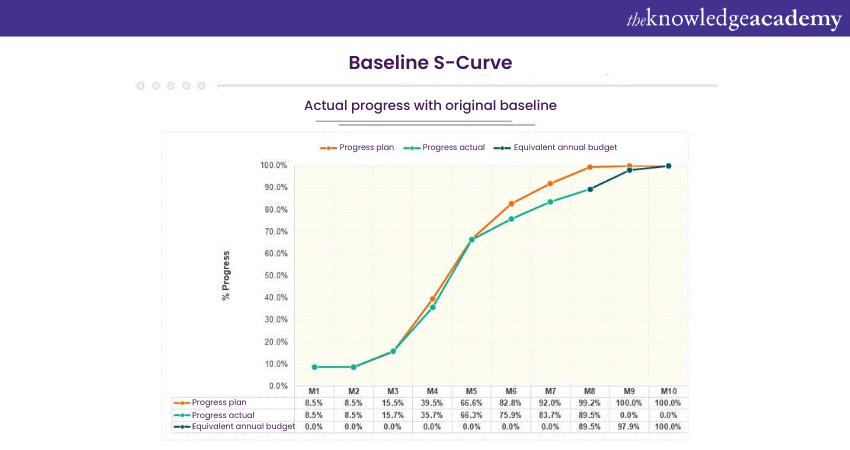
Baseline S-Curve
This is the first S-Curve that every Project Manager uses to show the planned progress of the project. Before the start of any project, Project Managers lay out plans for allocating both manual and financial resources for the same project. This Curve also shows the estimated time required to complete the project. Here's what it looks like:
Increase your knowledge of Project Management with our Project Management Course - join today!
Target S-Curve
This is a modification of the Baseline S-Curve, and it evolves as the production process evolves. This Curve intersects with the Baseline Curve at the end of the project if the project is completed according to the planned schedule and under budget.
However, it can also be at the bottom and to the left of the Baseline if the project is completed before the deadline and under budget. However, in most cases, projects end up being completed over time and over budget. Thus, this Curve lies above and to the right of the Baseline S-Curve.
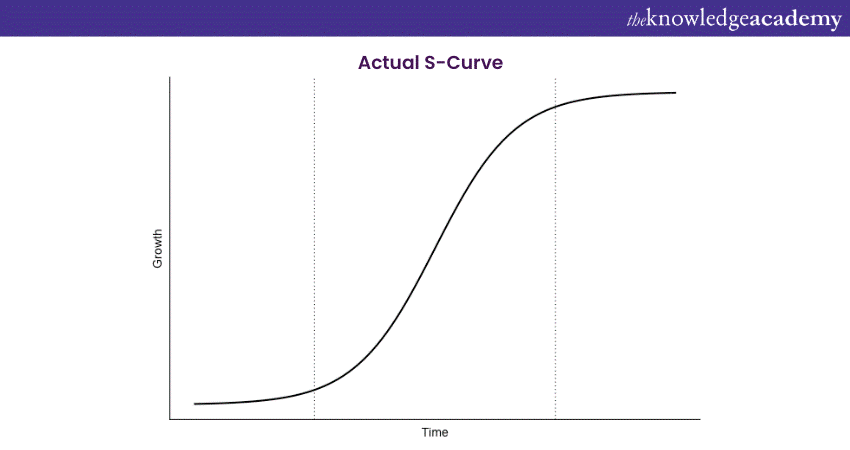
Actual S-Curve
This Curve is made after frequent revisions of the lifecycle of a project. These revisions show completed work data, the actual progress and the actual time taken by the project to complete its lifecycle.
This S-Curve is generally used alongside with the Baseline Curve as it helps the Project Managers evaluate the team’s performance. Generally, it ends after the final date of the end of the project and matches with the target S-Curve. Here's what this Curve looks like:
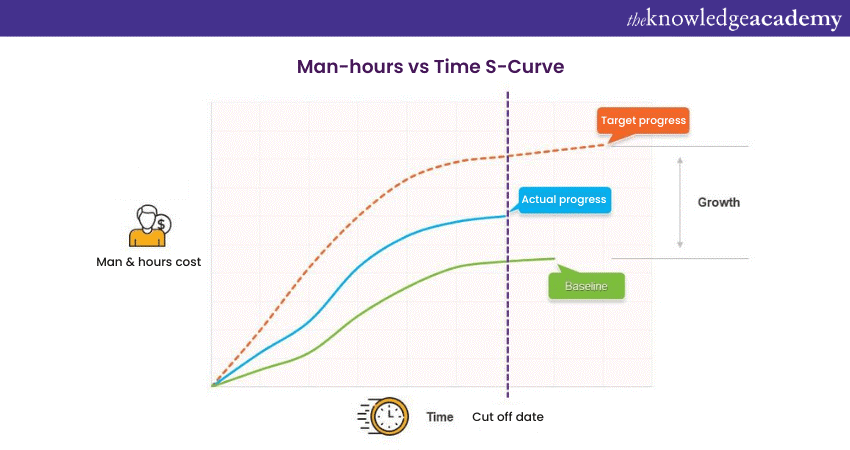
Man-hours S-Curve
This Curve shows the Managers the number of man-hours that are put into the project throughout its production process. The man-hours are calculated by adding the number of hours and the human resources that are needed for the project. Here's what a Man-hour Curve looks like:
Want to become an expert in Project Management? Then register for our Project Management Black Belt Course!
Reasons to use an S-Curve in Project Management
Here are the reasons for utilising S-Curves in project monitoring and decision-making for enhanced effectiveness.
1) Performance and progress evaluation
S-Curves provide a visual representation of project progress across time, allowing Managers to compare performance against set goals and milestones.
2) Cash flow forecasts
S-Curves simplifies cash flow planning by tracking expenses or expenditures over the project timetable, allowing Managers to predict financial requirements and spend resources more efficiently.
3) Quantity output comparison
S-Curves enable the comparison of actual output or productivity levels to expected predictions, helping in identifying productivity trends and breaks from intended targets.
4) Schedule a range of possibilities
S-Curves show the range of possible project timetables or deadlines, allowing Managers to identify Managing Project Risks and Uncertainties.
How to create an S-Curve?
Here are some examples which will show you how to create S-Curves in Excel:
Example 1
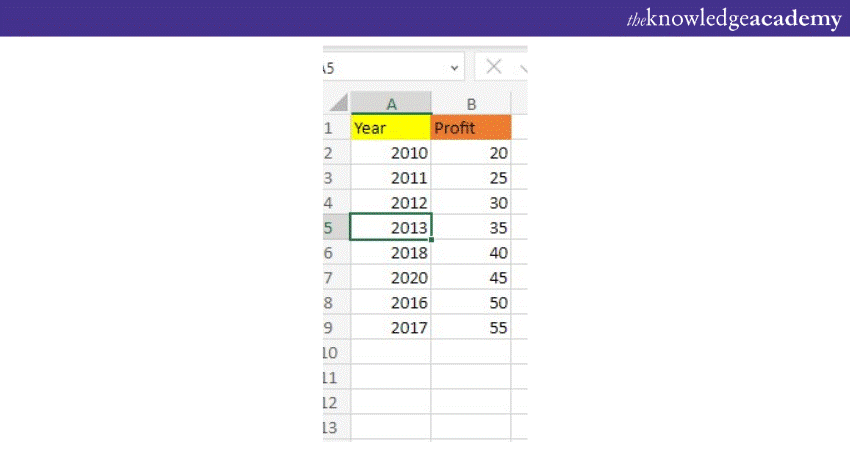
In this example, you are going to learn how to create an S-Curve for profits earned during different years:
a) First, select the data that you want to represent, as shown in the image:
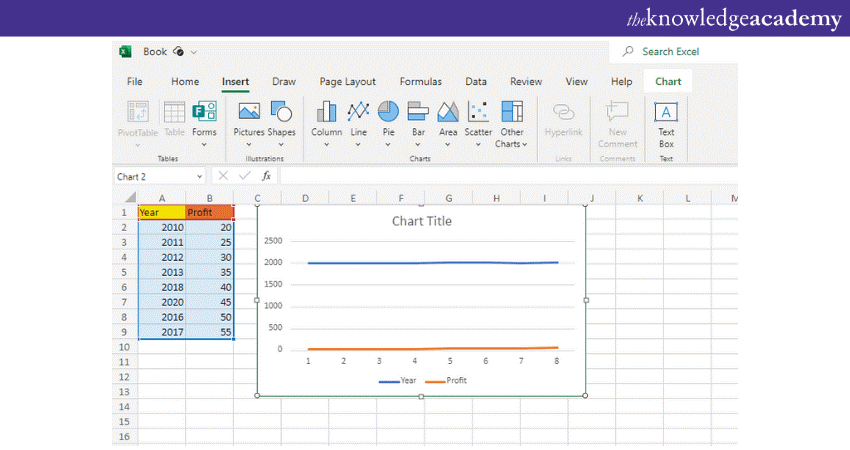
b) Then select the “Insert” option. Nore, click on the “Line” option to create a Line Chart, as shown below:
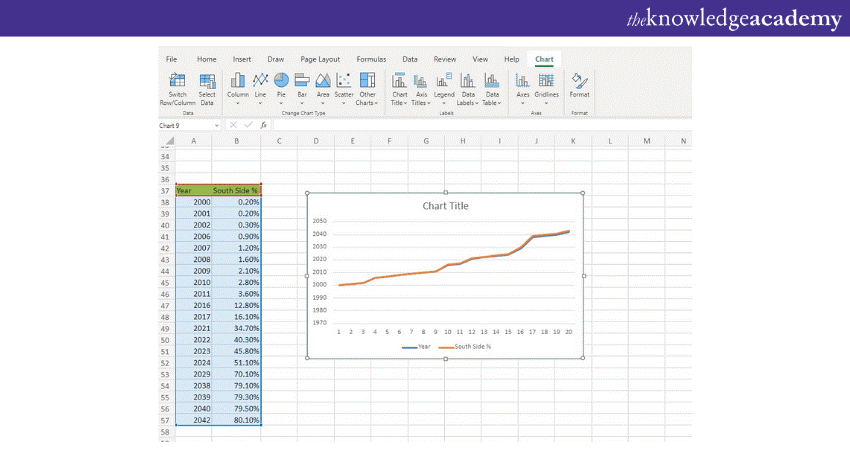
c) Now, you can also select the “Scatter” graph option if it is required for your project. It will look like the following images:
Project Managers use these Curves to track the team as well as project performances. These Curves show them the underlying issues and causes that can have the potential to stop the projects. They also help the Project Managers by giving early warnings, which can help them devise strategies to avoid errors.
The different types of S-Curves help the Managers create a comparison between the overall time that is required to complete the project and the actual time that is taken to complete the project. This comparison helps them develop strategies to be more efficient and make good strategies for Time Management.
The allocation of resources to different projects is generally decided with the help of the S-Curves. These Curves show the Project Managers the estimated financial resource allocation, human resource allocation and time required to complete the different projects. With proper allocation, Managers can be more efficient in carrying out the assignments for the company's assignments.
Project Managers can control the costs with the help of S-Curves. For example, let’s say Project A requires a large amount of capital for its completion, whereas Project B requires a relatively small amount of capital for its completion. However, as you know, the scenario changes during the lifecycle of the projects, and the costs may either increase or decrease. In this case, Managers still need an estimate to allocate a budget. They can decide on budget allocation with the help of these S-Curves.
Risk Management is a big part of Project Management. Only after analysing risks in the Risk Management Process can Managers schedule the time required by the lifecycle of the projects. S-Curves help to identify these potential threats so that they can formulate strategies to combat these threats and make the completion process for the lifecycle smooth. Also, these Curves warn Managers against any threats that may cause a heavy financial loss.
As you know, projects are generally overlooked by both the management as well as the stakeholders. To help them understand the lifecycle, budget, resource allocation, and potential risks, S-Curves are used as a universal language. By utilising these Curves, these stakeholders can have an estimate of the projects.
It may so happen that there are more than two projects targeted to be completed at the same time. Thus, Managers or stakeholders may get confused about which project to prioritise. To help them gain clarity, these Curves show them the high-priority projects that are required to be completed first. In this way, the Project Managers can stay on top of things without missing out on the important details.
The whole idea of using S-Curves is to identify the potential of the team members who are a part of the projects. By evaluating multiple Curves side by side, Project Managers can get an idea of how the team is performing, their productivity and if they are using their optimum productivity.
Moreover, Project Managers can compare the actual progress of the project with the planned or estimated progress of the project. This comparison helps the managers get a complete idea of the areas they need to advise their team to improve.
The S-Curves can also monitor the products that result from the projects' output and their sales. Managers use this tool to identify the sales of the products, strategies that are used for marketing those products and the time taken for the products to sell.
Learn all the intricate details of Project Management with our Project Management Green Belt Course - join today!
Understanding the Lines in an S-Curve
Lines in an S-Curve are of two different types, let’s explore them below:
Front-loaded S-Curve
A front-loaded S-Curve starts suddenly and flattens out over time. In this instance, additional time and resources are given to the project's initial phases. Projects with a high level of recurrence but limited pre-planning time might experience this. It is frequently seen with projects that have been rushed from the start.
Back-loaded S-Curve
Back-loaded S-Curves begin with a more moderate slope and gradually get sharper as the work continues, with most of the resources planned to be used later. A back-loaded S-Curve indicates early, broad project planning and design, as well as quick development.
Conclusion
S-Curve is one of the most important tools that Project Managers can utilise to keep track of their projects. With the help of these different types of Curves, they can avoid any rounding error, major financial loss, and proper budget and human resource allocation. With the help of these Curves, Managers can help the company generate a generous amount of revenue.
Want to elevate your skills in Project Management with no prior experience? Sign up for our Project Management for Non-Project Managers Course.
Frequently Asked Questions
What are the benefits of the S-Curve?

The benefits of the S-Curve include visual performance evaluation, cash flow forecasting, and quantity output comparison. Additionally, it aids in assessing the range of project schedule possibilities, facilitating effective project monitoring and decision-making.
Is an S-Curve a function?
Yes, an S-Curve can be represented as a mathematical function. It typically follows an "S" shape, which can be described by various mathematical equations or models.
What are the other resources and offers provided by The Knowledge Academy?
The Knowledge Academy takes global learning to new heights, offering over 30,000 online courses across 490+ locations in 220 countries. This expansive reach ensures accessibility and convenience for learners worldwide.
Alongside our diverse Online Course Catalogue, encompassing 17 major categories, we go the extra mile by providing a plethora of free educational Online Resources like News updates, Blogs, videos, webinars, and interview questions. Tailoring learning experiences further, professionals can maximise value with customisable Course Bundles of TKA.
What is the Knowledge Pass, and how does it work?
The Knowledge Academy’s Knowledge Pass, a prepaid voucher, adds another layer of flexibility, allowing course bookings over a 12-month period. Join us on a journey where education knows no bounds.
What are the related courses and blogs provided by The Knowledge Academy?
The Knowledge Academy offers various Project Management Courses, including Project Management Certification Course, Project Management Office Fundamentals Certification Course, and Jira Training. These courses cater to different skill levels, providing comprehensive insights into Digital Project Management.
Our Project Management Blogs cover a range of topics related to Project Management, offering valuable resources, best practices, and industry insights. Whether you are a beginner or looking to advance your Project Management skills, The Knowledge Academy's diverse courses and informative blogs have you covered.
Upcoming Project Management Resources Batches & Dates
Date
 Introduction to Project Management Course
Introduction to Project Management Course
Fri 10th Jan 2025
Introduction to Project Management Course
Fri 14th Mar 2025
Introduction to Project Management Course
Fri 9th May 2025
Introduction to Project Management Course
Fri 15th Aug 2025
Introduction to Project Management Course
Fri 10th Oct 2025
Introduction to Project Management Course
Fri 12th Dec 2025
 If you wish to make any changes to your course, please


