


 Top Rated Course


We may not have the course you’re looking for. If you enquire or give us a call on +44 1344 203 999 and speak to our training experts, we may still be able to help with your training requirements.
Top 10+ Grafana Alternatives That You Should Consider
Sienna Roberts 15 November 2024Looking for Grafana Alternatives? Explore our curated list of the top 10+ Grafana Alternatives that offer powerful features and capabilities. Find the perfect solution to meet your data visualisation and monitoring needs. In this blog, we'll delve into a curated selection of powerful Grafana Alternatives, each tailored to specific needs and use cases

Training Outcomes Within Your Budget!
We ensure quality, budget-alignment, and timely delivery by our expert instructors.
Table of Contents

Grafana, a renowned open-source platform, is a powerful tool for monitoring and visualisation. Offering an array of built-in features and a wealth of community templates, it enriches the user experience. Nevertheless, Grafana can prove challenging for newcomers due to its extensive configuration demands and occasionally overwhelming documentation. This leads to users searching for Grafana Alternatives with similar functionalities that may serve their needs.
Here is a curated selection of powerful Grafana Alternatives, each tailored to specific needs and use cases. Discover how these alternatives can redefine your data monitoring and visualisation experience.
Table of Contents
1) What is Grafana?
2) Best Grafana Alternatives for 2023
a) Instana
b) DataDog
c) NewRelic
d) D3.js
e) Power BI
f) Kibana
g) Tableau
h) QlikView
3) Conclusion
What is Grafana?
Grafana is an open-source analytics and monitoring platform that integrates with various data sources, providing users with a centralised and visually appealing way to track, analyse, and understand metrics over time. With its extensive plugin ecosystem and flexible features, Grafana is a powerful tool for data visualisation, dashboard creation, and alerting.
Advantages of Grafana
Grafana offers several advantages, making it a popular choice for monitoring and analytics. Its key strengths include:
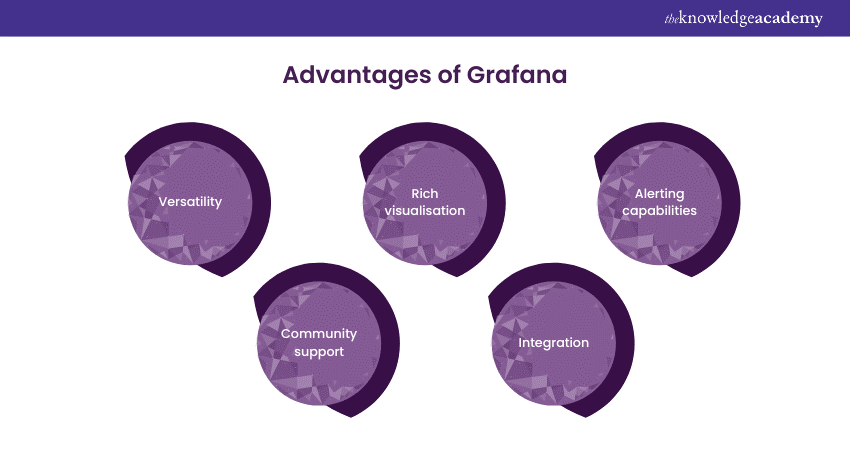
a) Versatility: Grafana supports many data sources, including popular databases, cloud services, and custom applications, ensuring compatibility with diverse systems.
b) Rich visualisation: The platform provides various visualisation options, from simple graphs to complex, interactive dashboards, allowing users to represent data in a meaningful and customisable manner.
c) Alerting capabilities: Grafana's alerting features empower users to set up notifications based on specified thresholds, ensuring timely responses to critical events.
d) Community support: With an active user community, Grafana benefits from frequent development and updates, along with a rich set of shared plugins and dashboards.
e) ntegration: Grafana seamlessly integrates with other monitoring tools and services, enhancing its functionality within different ecosystems.
Ace Your Next Interview with These Top Grafana Interview Questions!
Disadvantages of Grafana
While Grafana excels in many areas, it has some limitations:
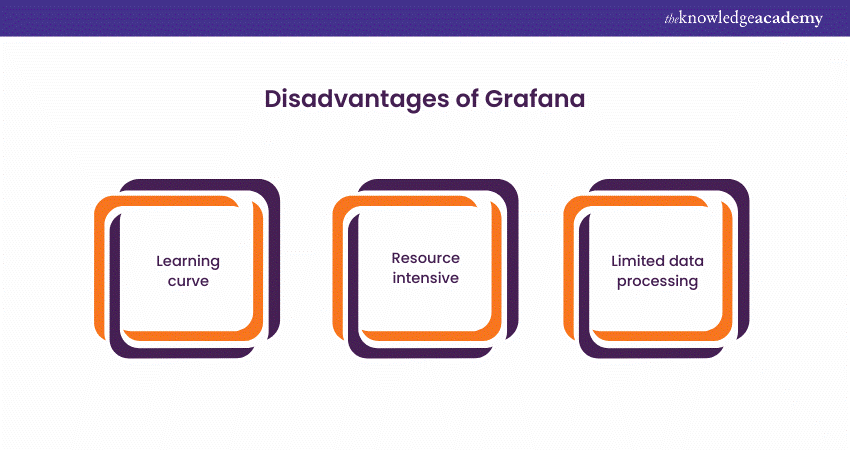
a) Learning curve: New users may find Grafana's features overwhelming, requiring time and effort to master the platform effectively.
b) Resource intensive: Running Grafana with multiple data sources and complex dashboards can demand substantial system resources, impacting performance.
c) Limited data processing: Grafana focuses on visualisation rather than data processing, which may limit its suitability for certain analytical tasks

Best Grafana Alternatives for 2023
|
Tool |
Features |
Pricing |
Ease of Use |
Target Use Cases |
|
Instana |
Application monitoring |
Subscription-based |
Moderate |
DevOps and IT operations |
|
DataDog |
Infrastructure monitoring |
Subscription-based |
User-friendly |
Cloud-based applications |
|
NewRelic |
Application performance |
Subscription-based |
Beginner-friendly |
Web applications |
|
D3.js |
Data visualisation library |
Open source |
Requires coding skills |
Custom data visualisations |
|
Power BI |
Business Intelligence |
Subscription-based |
User-friendly |
Data analysis and reporting |
|
Kibana |
Log and data analysis |
Open source |
Requires technical skills |
Log analysis and visualisation |
|
Tableau |
Data visualisation |
Subscription-based |
User-friendly |
Data analysis and reporting |
|
QlikView |
Business Intelligence |
Subscription-based |
Moderate |
Business data analysis |
|
Knime |
Data analytics |
Open source/Commercial |
User-friendly |
Data mining and analytics |
|
Redash |
Data visualisation |
Open source/Commercial |
User-friendly |
Data exploration and sharing |
|
Charted |
Data visualisation |
Open source |
Beginner-friendly |
Simple data visualisations |
|
Dygraphs |
Charting library |
Open source |
Requires coding skills |
Interactive charts |
Discover What Grafana Is and How It Transforms Data Visualization!
1) Instana
Instana is a comprehensive observability platform that has gained prominence for its automatic discovery and monitoring capabilities, especially in microservices and containerised environments. Its real-time insights and robust performance monitoring make it a valuable Grafana alternative.
Key Features:
a) Automatic discovery of microservices and containers.
b) Real-time application performance monitoring.
c) Seamless integration with Grafana for enhanced visualisation.
Use Cases:
Instana is particularly beneficial for organisations relying on microservices architecture. Its automatic discovery feature simplifies monitoring in dynamic environments.
Advantages:
Instana's automatic discovery and real-time insights set it apart, providing a more proactive approach to monitoring compared to Grafana's visualisation-centric focus.
Disadvantages:
While powerful, Instana might be perceived as more complex, and organisations with more straightforward monitoring needs might find it overkill.
Grafana vs Kibana: Which Tool Fits Your Data Visualization Needs?
2) DataDog
DataDog is a cloud-based monitoring and analytics platform that provides comprehensive visibility across applications, infrastructure, and logs. Known for its collaboration features and user-friendly interface, DataDog stands as a versatile Grafana substitute.
Key Features:
a) Anomaly detection for early issue identification.
b) Log management and analytics.
c) Application Performance Monitoring (APM) for detailed insights.
Use Cases:
DataDog is suitable for organisations looking for a comprehensive monitoring solution that covers various aspects, including infrastructure, logs, and applications.
Advantages:
DataDog excels in user-friendly collaboration and offers features like anomaly detection and log management, providing a holistic monitoring experience.
Disadvantages:
Cost might be a factor for some organisations, as DataDog can be relatively expensive based on usage.
3) NewRelic
NewRelic is a specialised application performance monitoring platform offering deep visibility into the performance of web applications. Its intuitive interface and powerful analytics make it a preferred choice for those seeking alternatives to Grafana.
Key Features:
a) Application performance monitoring for detailed insights.
b) Accurate user monitoring to understand end-user experiences.
c) Infrastructure monitoring to track server performance.
Use Cases:
NewRelic is ideal for organisations focused on optimising the performance of their web applications, making it a valuable tool for DevOps teams.
Advantages:
NewRelic's specialised focus on application performance monitoring provides in-depth insights that Grafana might not offer out of the box.
Disadvantages:
Like DataDog, cost might be a factor for smaller organisations or those with budget constraints.
Compare Grafana and Datadog: Find the Best Monitoring Platform!
4) D3.js
D3.js is not a complete monitoring solution; it is a JavaScript library for creating dynamic and interactive data visualisations in the web browser. While not a direct replacement for Grafana, it is often used with other tools to build custom visualisations.
Key Features:
a) JavaScript library for creating custom data visualisations.
b) Extensive support for building interactive charts and graphs.
Use Cases:
D3.js is suitable for organisations or developers looking to create highly customised and interactive visualisations tailored to their needs.
Advantages:
D3.js provides unparalleled flexibility in creating custom visualisations, allowing organisations to build unique, tailored dashboards.
Disadvantages:
The learning curve for D3.js can be steep for those without extensive JavaScript and data visualisation experience.
5) Power BI
Microsoft Power BI is a tool for business analytics that offers interactive visualisations and business intelligence capabilities. Users can create insightful reports and dashboards, providing a different approach than Grafana.
Key Features:
a) Business analytics with a focus on creating interactive dashboards.
b) Integration with various data sources for comprehensive insights.
c) Collaboration features for team-based analytics.
Use Cases:
Power BI is well-suited for organisations heavily invested in the Microsoft ecosystem and seeking a business intelligence tool with solid visualisation capabilities.
Advantages:
Power BI's strength lies in its business intelligence features, making it a preferred choice for organisations looking beyond traditional monitoring.
Disadvantages:
Integration challenges might arise for organisations not heavily invested in the Microsoft ecosystem.
6) Kibana
Kibana, part of the Elastic Stack, is known for its robust log analysis and visualisation capabilities. It seamlessly integrates with Elasticsearch, making it a compelling choice for log-centric monitoring needs.
Key Features:
a) Log analysis and visualisation.
b) Integration with Elasticsearch for robust data storage and retrieval.
c) Dashboard creation for real-time insights.
Use Cases:
Kibana is particularly beneficial for organisations relying on Elasticsearch for log storage and analysis, making it a crucial component of the Elastic Stack.
Advantages:
Kibana's strength in log analysis, especially with Elasticsearch, sets it apart for organisations with extensive logging needs.
Disadvantages:
While robust for log analysis, Kibana might not provide the same breadth of features as Grafana for diverse monitoring needs.
7) Tableau
Tableau is a powerful data visualisation platform that enables users to create interactive, shareable dashboards. With a focus on business intelligence, it offers robust visualisation options and supports various data sources.
Key Features:
a) Data visualisation with a focus on business intelligence.
b) Interactive dashboards for comprehensive insights.
c) Extensive support for various data connectors.
Use Cases:
Tableau is ideal for organisations prioritising business intelligence and seeking advanced visualisation features for their data.
Advantages:
Tableau's focus on business intelligence and advanced visualisation features makes it a preferred choice for organisations emphasising data storytelling.
Disadvantages:
Like Power BI, integration challenges might arise for organisations that are not aligned with Tableau's ecosystem.
8) QlikView
QlikView is a business discovery platform that facilitates interactive data visualisation and exploration. It emphasises user-driven analytics and associative data modelling, distinguishing it from Grafana in terms of approach.
Key Features:
a) Business discovery for user-driven analytics.
b) Associative data modelling for in-depth exploration.
c) Collaboration features for team-based analytics.
Use Cases:
QlikView is suitable for organisations looking for a user-driven analytics platform that allows end-users to explore and discover insights.
Advantages:
QlikView's focus on user-driven analytics and associative data modelling provides a different approach than Grafana's visualisation-centric model.
Disadvantages:
Complex data models might require a learning curve, and organisations seeking simplicity might find other tools more suitable.
9) Knime
Knime is an open-source platform that allows users to perform data analytics, reporting, and integration. It is a powerful tool for data scientists and analysts alike. It provides a visual interface for creating data workflows, making it a suitable alternative for those seeking a different workflow-based approach.
Key Features:
a) An open-source platform for data analytics.
b) Visual interface for creating data workflows.
c) Integration with various data sources for comprehensive analytics.
Use Cases:
Knime is ideal for organisations seeking an open-source, workflow-based data analytics and integration platform.
Advantages:
Knime's workflow-based approach provides a different paradigm for data analytics, making it suitable for organisations with specific workflow requirements.
Disadvantages:
The open-source nature might mean less comprehensive support compared to commercial solutions.
10) Redash
Redash is an open-source tool designed for data visualisation and collaboration. It supports various data sources and offers a simple way to create shareable dashboards, making it an alternative for collaborative data exploration.
Key Features:
a) Open-source tool for data visualisation and collaboration.
b) Support for various data sources.
c) Simple dashboard creation for easy collaboration.
Use Cases:
Redash is suitable for organisations looking for an open-source solution emphasising collaboration and simplicity in data exploration.
Advantages:
Redash's focus on simplicity and collaboration makes it a preferred choice for organisations valuing ease of use.
Disadvantages:
While simple, Redash might not offer the same depth of features as Grafana, especially for complex monitoring needs.
11) Charted
Charted is a straightforward tool for creating simple, shareable charts. While not as feature-rich as Grafana, it is a quick solution for users seeking simplicity and ease of use.
Key Features:
a) Simple tool for creating shareable charts.
b) Minimalistic approach for quick chart creation.
c) Shareable charts for easy collaboration.
Use Cases:
Charted is suitable for users seeking a quick, straightforward solution for creating and sharing simple charts.
Advantages:
Charted's simplicity and minimalistic approach make it an easy-to-use tool for basic charting needs.
Disadvantages:
Lacks the extensive features and customisation options offered by more robust solutions like Grafana.
12) Dygraphs
Dygraphs is a JavaScript library for creating interactive, zoomable charts. While it's more focused on visualisation, it can be integrated into web applications to display time-series data effectively.
Key Features:
a) JavaScript library for creating interactive charts.
b) Zoomable charts for in-depth exploration.
c) Time-series data visualisation capabilities.
Use Cases:
Dygraphs is ideal for organisations or developers looking for a JavaScript library to enhance time-series data visualisation in web applications.
Advantages:
Dygraphs provides specific capabilities for time-series data visualisation, offering a focused solution for organisations with such requirements.
Disadvantages:
Limited to time-series data and not as comprehensive as Grafana for diverse monitoring needs.
Conclusion
Exploring Grafana alternatives is a strategic move, allowing you to tailor your monitoring and visualisation tools to your unique requirements. Whether it's scalability, specific use cases, or cost considerations, these alternatives offer diverse solutions. Choose wisely to optimise your data management and analysis endeavours.
 If you wish to make any changes to your course, please


