We may not have the course you’re looking for. If you enquire or give us a call on +61 272026926 and speak to our training experts, we may still be able to help with your training requirements.
We ensure quality, budget-alignment, and timely delivery by our expert instructors.

Microsoft Excel is not merely a professional skill; it goes beyond this traditional boundary. Today, 81% of businesses globally use Excel Skills to boost their data analysis, financial reporting, and management tasks. Some of the key Excel Skills to highlight in this blog include sorting data using advanced tools like VBA Macros and Power Pivots.
Let's continue sailing into this enthralling journey through the vast, knowledge-driven ocean. It will be an exciting quest, so we recommend you read to the end while grabbing a cup of coffee in one hand and unplugging from the hustle of the digital world.
Table of Contents
1) Why Excel Skills are important in the Job Market?
2) What Are the Top Excel Skills for Professionals?
a) Data Filters
b) Data Sorting
c) COUNTIF/COUNTIFS
d) Shortcut Keys
e) Flash Fill
3) Conclusion
Why Excel skills are Important in the Job Market?
If someone is applying for a data-related job, then it is important to have skills and experience related to Excel. Excel is used in a variety of jobs and helps a person to complete his daily tasks.
It is one of the best spreadsheet software in the market and can perform a variety of tasks at once. According to the Microsoft Excel Formulas Guide, Office clerks and Administrative Assistants depend on this software, as it is one of the most crucial tools in their toolbox.
Excel is often used in education for administrative purposes, such as tracking student performance, organising schedules, and analysing data. Not just this, Excel has a wide scope, and it's crucial to include Excel skills on your resume, as it is also extensively used by Financial Analysts, Investment Bankers, and other businesses.
What Are the Top Excel Skills for Professionals?
Building a strong foundation in Excel is essential for effectively managing data and streamlining workflows. These abilities are crucial for handling daily professional tasks, from organising datasets to utilising advanced tools. In the midst of mastering how to use Excel for accounting, here are the top Excel skills every professional should know:
1) Data Filters
Most Excel users consider data filters an easy skill. However, for efficient use of Microsoft Excel, it's important to understand data filters along with other essential features like Splitting Cells in Excel. Data filters enable you to search, hide, and categorise relevant information on the spreadsheet as and when required.
2) Data Sorting
Data sorting is essential for organizing information in spreadsheets in a structured order based on the user’s needs. While working on Making a Marksheet in Excel, this technique can initially seem tricky, as sorting only a single column or row instead of the entire dataset may lead to a disorganized and complex spreadsheet.
3) COUNTIF/COUNTIFS
The COUNTIFS function of Microsoft Excel is used to count the number of cells in a specific row or column. However, it's essential to know that these cells should align with a single or numerous criteria. You can include COUNTIFS in the cell of the Excel worksheet in the form of a formula.
4) Shortcut Keys
Excel is mainly used to carry out a specific task. Therefore, you must have a thorough knowledge of the shortcut keys. With this application, you will be able to perform your work directly on your keyboard, even without the use of a mouse.
5) Flash Fill
Flash Fill in Excel is an intelligent tool that automatically completes data based on the pattern it detects from your input. It simplifies repetitive tasks by recognising the format you apply to a sample entry and replicating it across the selected data range.
Excel in data automation through Microsoft Excel VBA and Macro Training- join today!
6) Pivot Tables

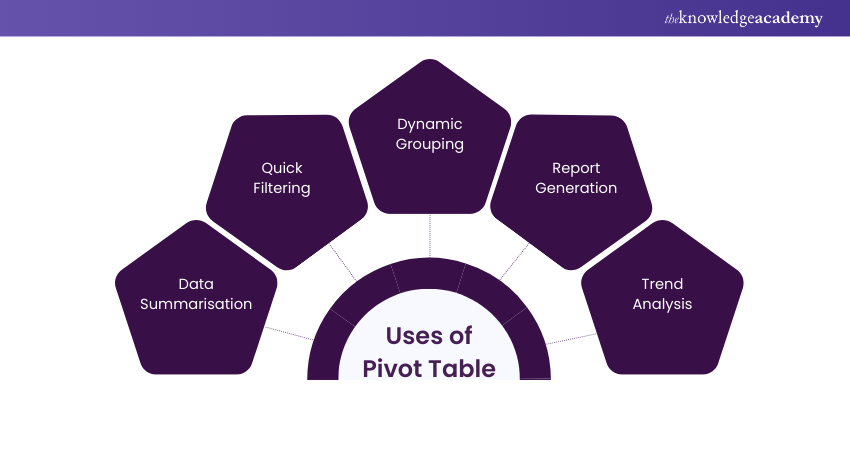
Pivot Tables help summarise vast volumes of data in the Excel spreadsheet in real-time. These tables work by categorising similar data into groups. To launch these tables, click on the Insert tab of the Tables section. You can then use these tables to sort, count, average, or total the data on a massive spreadsheet. The ability of pivot tables to generate meaningful data without using an individual formula is considered helpful for employers.
Pivot tables summarise vast volumes of data in the Excel spreadsheet in real-time. These tables work by categorising similar data into groups. You can launch these tables by clicking on the Insert tab of the Tables section. You can use these tables to sort, count, average, or total the data on a massive spreadsheet. The ability of pivot tables to generate meaningful data without using an individual formula is considered helpful for employers. Creating a Pivot table is easy, even if you're presented with massive amounts of information. Besides, you'll be able to remove duplicates, count entries, assess your data, and learn How to Find Duplicates in Excel.
7) Charts
Charts in Excel are used to create a graphical representation of any dataset. They can be depicted as lines in a line chart or bars structures in a bar chart apart from other graphical elements depending on the different types of Excel. These include Gantt Chart, Column Chart, Waterfall Chart, Bubble Chart, Pie Chart, etc.
8) Power Pivots
Power Pivot in Excel is a robust tool that helps you work with large amounts of data from different sources. It allows you to analyse, combine, and create reports without slowing down your Excel file. You can think of it as a way to boost your data analysis operation.
Optimise bookkeeping skills using Excel- sign up for our Excel for Accounting Course today!
9) SUMIF
The SUMIF function in Excel allows you to add up values within a range that meet a specific condition or criteria. It is particularly useful when summing data based on a single rule. For instance, the SUMIF formula can be applied when adding cells that contain a specific word or number. Additionally, it can be utilized for summing cells related to a particular type or class of item, making it beneficial when working on tasks like Creating Invoice Format in Excel to calculate totals based on set conditions.
10) Conditional Formatting

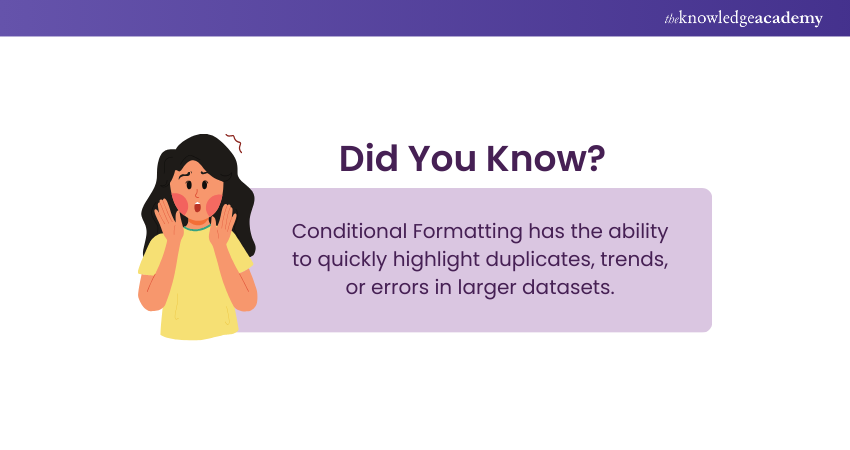
Conditional Formatting in Excel is a feature that automatically alters the appearance of cells based on specific rules or conditions. It helps to visually highlight important data, trends, or patterns in your spreadsheet, making it easier to analyse.
11) IFERROR
Mistakes are bound to happen when carrying out advanced Excel functions. These errors arise when data is missing in a particular area or when a problem requires immediate attention. To this end, IFERROR can generate text or blank cells and eliminate error codes. An empty cell or specific text is attached to the cell that should be re-verified.
12) Index Match
INDEX MATCH in Excel is a powerful combination of two functions used to look up and retrieve data from a table on a basis of a specific criteria. It is more flexible and robust than the VLOOKUP function because it can work in any direction and is not limited to left-to-right lookups.
13) Macros in Excel VBA
Macros in Excel VBA (Visual Representation Application) is a vital tool in Excel that helps create custom user-generated functions. They are majorly used to access the Windows Application Programming Interface (API). Macros save time by performing actions automatically that would otherwise require manual input.
Transform data into data-driven strategies- kickstart your Business Analytics with Excel Course today!
Conclusion
Excel Skills are an invaluable asset in industries such as finance, data analysis, and project management, where data organisation and analysis are critical. In today's world, candidates with strong Excel Skills have a strong demand. However, many industries also consider proficiency in Excel Alternatives, as they often provide different strengths for specific workflows.
Streamline your project visualisation with our Excel Training with Gantt Charts- register today!
Frequently Asked Questions
How to Explain Excel Skills in an Interview?

When explaining Excel Skills in an interview, you must highlight your proficiency with tools like PivotTables, VLOOKUP, or VBA Macros. You should also mention practical applications, which can range from analysing large datasets to creating detailed financial reports.
What Jobs Can You Get With Excel Skills?

Excel Skills can help to pursue roles like Data Analyst, Financial Analyst, Accountant, Project Manager, and HR Specialist. These jobs often require tasks like analysing data, creating financial models, and managing reports. By gaining proficiency in this vital MS Office application, you can add value across industries.
What are the Other Resources and Offers Provided by The Knowledge Academy?

The Knowledge Academy takes global learning to new heights, offering over 3,000 online courses across 490+ locations in 190+ countries. This expansive reach ensures accessibility and convenience for learners worldwide.
Alongside our diverse Online Course Catalogue, encompassing 19 major categories, we go the extra mile by providing a plethora of free educational Online Resources like News updates, Blogs, videos, webinars, and interview questions. Tailoring learning experiences further, professionals can maximise value with customisable Course Bundles of TKA.
What is The Knowledge Pass, and How Does it Work?

The Knowledge Academy’s Knowledge Pass, a prepaid voucher, adds another layer of flexibility, allowing course bookings over a 12-month period. Join us on a journey where education knows no bounds.
What are the Related Courses and Blogs Provided by The Knowledge Academy?

The Knowledge Academy offers various Microsoft Excel Courses, including Microsoft Excel Course, Microsoft Excel VBA and Macro Training, and Excel Training with Gantt Charts. These courses cater to different skill levels, providing comprehensive insights into the Use of Excel in Business Analysis.
Our Office Applications Blogs cover a range of topics related to Microsoft Office tools, offering valuable resources, best practices, and industry insights. Whether you are a beginner or looking to advance your Excel and Office skills, The Knowledge Academy's diverse courses and informative blogs have got you covered.
Upcoming Office Applications Resources Batches & Dates
Date
 Microsoft Excel Course
Fri 16th May 2025
Fri 11th Jul 2025
Fri 19th Sep 2025
Fri 21st Nov 2025
Fri 9th Jan 2026
Fri 6th Mar 2026
Fri 1st May 2026
Fri 3rd Jul 2026
Fri 6th Nov 2026


 Top Rated Course


 If you wish to make any changes to your course, please


