


 Top Rated Course

We may not have the course you’re looking for. If you enquire or give us a call on + 1-866 272 8822 and speak to our training experts, we may still be able to help with your training requirements.
How to Create Date Hierarchy in Power BI? A Complete Guide
Sienna Roberts 18 November 2024Interested in efficiently organising time-based data in Power BI? If yes, you can master the process for insightful data analysis with our step-by-step blog on creating a Date Hierarchy. Delve into this comprehensive blog to learn more about the hassle-free steps you need to follow on How to Create Date Hierarchy in Power BI.

Training Outcomes Within Your Budget!
We ensure quality, budget-alignment, and timely delivery by our expert instructors.
Table of Contents

Creating a Date Hierarchy in Power BI can revolutionise the way different professionals interpret and visualise time-based data. With its intuitive features and robust capabilities, Power BI offers a powerful toolkit for organising and analysing temporal data. You can efficiently navigate through time-based data, from high-level trends to granular details by creating a Date Hierarchy in Power BI. Hence, this complete blog on “How to Create Date Hierarchy in Power BI?” might empower you to unlock valuable insights and trends within your datasets.
In this comprehensive blog, we will explore the step-by-step process of creating a Date Hierarchy in Power BI. Whether you are new to Power BI or looking to enhance your skills, this blog is designed to be accessible and informative.
By the end, you'll have the knowledge and confidence to create a Date Hierarchy that suits your data analysis needs. Get ready to uncover hidden trends, visualise temporal patterns, and gain actionable insights with Power BI's Date Hierarchy feature.
Table of Contents
1) What is Power BI Date Hierarchy?
2) Steps to Create Date Hierarchy in Power BI?
3) Advantages of Date Hierarchy in Power BI
4) Disadvantages of Date Hierarchy in Power BI
5) Conclusion
What is Power BI Date Hierarchy?
In the realm of data analytics, Power BI's Date Hierarchy feature is a valuable tool for analysing time-based data. This functionality enables users to create a structured hierarchy of Date-related fields. Those Date-related fields include a year, quarter, month, and day, facilitating smoother navigation and analysis of temporal data. For example, in a sales dataset, having a Date Hierarchy allows users to easily drill down from yearly trends to monthly or even daily insights.
This structured approach simplifies the process of understanding trends, patterns, and seasonality within the data. Power BI's Date Hierarchy feature provides a framework that enhances the visualisation and interpretation of time-based metrics. Furthermore, it offers a more intuitive and efficient approach to data analysis.

Steps to Create Date Hierarchy in Power BI?
Mastering the creation of a Date Hierarchy in Power BI opens doors to efficient and insightful data analysis. Moreover, Date Hierarchy is a structured framework that organises time-based data into meaningful levels. This Hierarchical structure further allows users to navigate through temporal data with ease, from high-level trends to granular details. To embark on How to Create Date Hierarchy in Power BI? you the go through the following process:
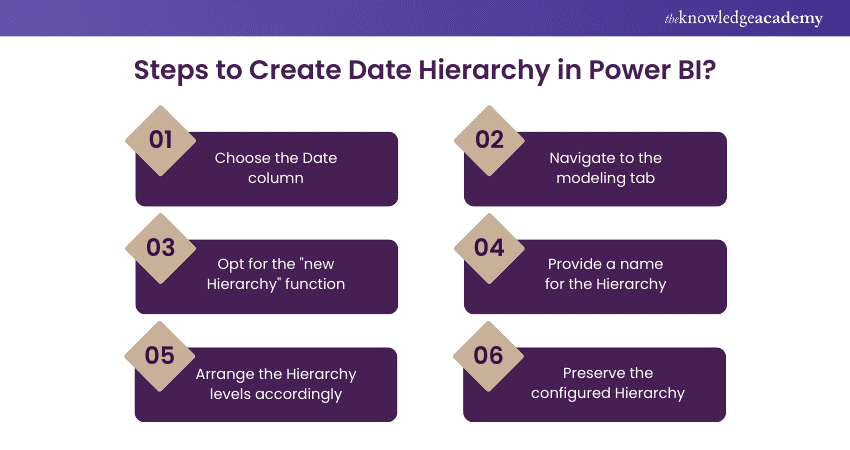
Step 1: Choose the Date column
The first step in creating a Date Hierarchy in Power BI is selecting the appropriate date column within your dataset. This column typically contains the raw date data that you wish to structure into a Hierarchy. For example, in a sales dataset, this column might include the transaction Date. By choosing this column, you can set the foundation for the subsequent steps, where Power BI will organise and group the dates based on your preferences.
Step 2: Navigate to the modeling tab
As the next step, you must navigate to the "modelling" tab located at the top of the Power BI interface. This tab further houses various tools and functions related to data modelling, including the option to create new hierarchies. By accessing the "Modelling" tab, you can enter the space where you can define the structure of your Date Hierarchy.
Step 3: Opt for the "new Hierarchy" function
Within the "modeling" tab, you can locate and click on the "new Hierarchy" button. This action prompts Power BI to initiate the process of creating a new hierarchy based on the selected date column. The "new Hierarchy" function further serves as the gateway to defining the levels and organisation of your date hierarchy.
Step 4: Provide a name for the Hierarchy
Upon selecting the "new Hierarchy" function, you'll be prompted to give a descriptive name to your Hierarchy. For clarity, this name should reflect the purpose and content of the Hierarchy. If your Hierarchy includes year, quarter, month, and day levels, you might name it "Date Hierarchy" or "transaction Date."
Step 5: Arrange the Hierarchy levels accordingly
With the Hierarchy created and named, you can arrange the levels in the desired order. Power BI also allows you to drag and drop the year, quarter, month, and day levels within the Hierarchy pane. This step is crucial as it determines the hierarchical structure of your Date data. For example, you might place the year at the top, followed by quarters, months, and days beneath.
Step 6: Preserve the configured Hierarchy
Once you have arranged the levels to your satisfaction, it is essential to save and preserve the configured Hierarchy. This ensures that the Hierarchy remains intact and accessible for future use in your Power BI reports and visualisations. Saving the hierarchy allows you to leverage its organised structure for efficient filtering, grouping, and analysis of your time-based data.
Take your Data Analysis skills to the next level with our Microsoft Power BI Data Analyst PL300 Course now!
Advantages of Date Hierarchy in Power BI
Power BI's Date Hierarchy offers several advantages that enhance the data analysis experience. From simplified analysis to efficient filtering and improved trend analysis, let us dive into its advantages below:

a) Simplified analysis: Power BI's Date Hierarchy simplifies data analysis by structuring time-based data into easily navigable levels. Users can effortlessly drill down from yearly trends to daily details, gaining valuable insights into trends and patterns.
b) Enhanced visualisations: Date Hierarchies in Power BI empower users to create visually engaging reports. By organising Dates into Hierarchies, reports can display data at varying levels of granularity. This enhances the visual appeal and clarity of reports, aiding in better data interpretation.
c) Improved trend analysis: With a Date Hierarchy, trend analysis becomes more intuitive and accurate. Users can also identify trends over specific time periods, compare performance across quarters or months. By doing so, they can gain a deeper understanding of seasonal patterns within the data.
d) Efficient filtering: Power BI's Date Hierarchy enables efficient filtering of data by various time periods. Whether it is filtering by year, month, or day, users can quickly focus on specific time frames for detailed analysis. This streamlined filtering capability also enhances efficiency in data exploration and decision-making.
e) Custom time comparisons: Users can easily compare data across custom time periods using the Date Hierarchy. For example, comparing sales performance this quarter to the same quarter last year becomes straightforward. This capability also aids in identifying growth trends, assessing progress, and making informed business decisions.
Empower your team with our Microsoft Power BI for End Users 55400AC Course – join us now!
Disadvantages of Date Hierarchy in Power BI
While Power BI's Date Hierarchy offers significant advantages, it is crucial to be aware of its potential limitations. Understanding these drawbacks can help users mitigate challenges and make informed decisions. Some of those disadvantages are as follows:

a) Limited flexibility: Power BI's Date Hierarchy comes with a predefined structure that may not meet the needs of all datasets. For datasets with complex date structures or non-standard calendars, users can find themselves restricted by the fixed Hierarchy levels. This limitation can hinder the ability to customise the Hierarchy according to specific requirements. Moreover, such drawbacks can lead to challenges in accommodating unique date formats or fiscal calendars.
b) Potential confusion: Incorrect configuration of the Date Hierarchy can result in data misinterpretation and confusion. For instance, placing the day level above the month level may lead to inaccuracies when analysing monthly trends. Such misconfigurations can cause discrepancies in data aggregation and reporting, compromising the accuracy of insights derived from the data.
c) Limited drill-through functionality: While Power BI allows users to drill down into data using the Date Hierarchy. But the functionality may be limited in certain scenarios. Users may find it challenging to drill down into specific date levels beyond the predefined Hierarchy. This can be particularly frustrating while investigating anomalies or trends at a more granular level than what the Hierarchy allows.
d) Cumbersome maintenance: Managing and maintaining a complex Date Hierarchy in Power BI can be cumbersome. As datasets evolve and new data sources are added, updating and ensuring the accuracy of the Hierarchy requires careful attention. Any changes to the Hierarchy structure or additions of new Date-related fields can disrupt existing reports and visualisations.
e) Performance impact: Utilising a Date Hierarchy in Power BI can impact performance, especially with large datasets in some cases. The Hierarchical structure adds an additional layer of complexity to data processing and visualisation. It can further lead to slower performance when generating reports or dashboards. Users may experience delays in loading times and refresh rates, particularly when working with extensive time-based data.
Conclusion
Creating a Date Hierarchy in Power BI provides a structured and organised approach to analysing time-based data. We hope that this step-by-step process on How to Create Date Hierarchy in Power BI empowers users to efficiently navigate and interpret temporal data. A well-structured Date Hierarchy in Power BI is an asset for some professionals.
Revitalise your analytical skills with our Microsoft Power BI Course – register today!
Frequently Asked Questions
What is Date Hierarchy in Power BI?

Date Hierarchy in Power BI is a structured organisation of date-related fields like year, quarter, month, and day. It simplifies data analysis by grouping dates for easy navigation and visualisation of time-based data.
How do you use Date and time in Power BI?
In Power BI, you can use Date and Time fields by selecting them in your dataset. Power BI automatically recognises these fields, allowing for easy creation of date hierarchies. It mostly filters by time periods, and creates insightful visualisations based on temporal data.
What are the other resources and offers provided by The Knowledge Academy?
The Knowledge Academy takes global learning to new heights, offering over 30,000 online courses across 490+ locations in 220 countries. This expansive reach ensures accessibility and convenience for learners worldwide.
Alongside our diverse Online Course Catalogue, encompassing 17 major categories, we go the extra mile by providing a plethora of free educational Online Resources like News updates, Blogs, videos, webinars, and interview questions. Tailoring learning experiences further, professionals can maximise value with customisable Course Bundles of TKA.
What is the Knowledge Pass, and how does it work?
The Knowledge Academy’s Knowledge Pass, a prepaid voucher, adds another layer of flexibility, allowing course bookings over a 12-month period. Join us on a journey where education knows no bounds.
What are related courses and blogs provided by The Knowledge Academy?
The Knowledge Academy offers various Business Intelligence Reporting Training, including the Microsoft Power BI Course, Business Objects Reporting Training, and Crystal Reports Training. These courses cater to different skill levels, providing comprehensive insights into Excel Data Visualization.
Our Office Applications Blogs cover a range of topics related to Power BI, offering valuable resources, best practices, and industry insights. Whether you are a beginner or looking to advance your Office Application skills, The Knowledge Academy's diverse courses and informative blogs have got you covered.
Upcoming Office Applications Resources Batches & Dates
Date
 Microsoft Power BI Course
Microsoft Power BI Course
Fri 6th Dec 2024
Microsoft Power BI Course
Fri 17th Jan 2025
Microsoft Power BI Course
Fri 21st Feb 2025
Microsoft Power BI Course
Fri 4th Apr 2025
Microsoft Power BI Course
Fri 6th Jun 2025
Microsoft Power BI Course
Fri 25th Jul 2025
Microsoft Power BI Course
Fri 7th Nov 2025
Microsoft Power BI Course
Fri 26th Dec 2025
 If you wish to make any changes to your course, please


