We may not have the course you’re looking for. If you enquire or give us a call on +32 35001305 and speak to our training experts, we may still be able to help with your training requirements.
We ensure quality, budget-alignment, and timely delivery by our expert instructors.

Alteryx and Power BI are two of the most popular Business Intelligence (BI) tools. They help you collect, analyse, and visualise data from various sources. However, Alteryx and Power BI have distinct features, strengths, and weaknesses that suit different needs and preferences. Therefore, one question is natural to arise: “Alteryx vs Power BI, which one should you choose?”
In this blog, we will compare Alteryx vs Power BI in terms of product overview, features, integrations, pricing, and more. We will also highlight the differences between Alteryx and Power BI and how they affect your Data Analysis capabilities. By the end of this blog, you will have a clear idea of the two tools and be able to choose the best one for your data insights.
Table of Contents
1) What is Power BI?
a) Benefits of Power BI
b) Drawbacks of Power BI
2) What is Alteryx?
a) Benefits of Alteryx
b) Drawbacks of Alteryx
3) Difference Between Power BI and Alteryx
a) Purpose and functionality
b) Features
c) Integrations
d) Pricing
e) Building business strategies
f) Ease of use and learning curve
g) Advanced analytics capabilities
4) Conclusion
What is Power BI?
Power BI is a cloud-based BI service from Microsoft that helps you create interactive dashboards and reports using data from various sources. Power BI has a user-friendly interface that lets you drag and drop data elements and choose from multiple visualisation options. You can also use Power BI Desktop, a free desktop application, to create and publish reports to the Power BI service. Power BI also has mobile apps for iOS, Android, and Windows devices to access your data on the go.

Benefits of Power BI
Some of the benefits of Power BI are:
a) It is easy to use and learn, especially for users familiar with Microsoft products such as Excel and PowerPoint.
b) It has a large and active community of users and developers to provide support, feedback, and resources.
c) It has a low cost of ownership, as it offers a free version for individual users and a low monthly fee for premium features and capacity.
d) It has a high level of scalability, as it can handle large volumes of data and users with the help of Azure cloud services.
e) It has rich features like Natural Language Queries, Artificial Intelligence, dataflows, and custom visuals.
Drawbacks of Power BI
Some of the drawbacks of Power BI are:
a) It has limited data preparation and transformation capabilities, as it relies on Power Query, which is not intuitive or flexible.
b) It has limited data science and advanced analytics capabilities, as it relies on R and Python scripts, which are poorly integrated or supported.
c) It has limited customisation and branding options, as it does not allow you to change the look and feel of the interface or the visuals.
d) It has limited security and governance features, as it does not allow you to control the access and usage of data and reports at a granular level.

What is Alteryx?
Alteryx is a self-service Data Analytics platform to prepare, blend, and analyse data from various sources. Alteryx has a graphical user interface that lets you build data pipelines using drag-and-drop tools and workflows. You can also use Alteryx Designer, a desktop application, to create and run workflows on your local machine. Alteryx also has a server and a cloud version that lets you share and execute workflows on a centralised platform.

Benefits of Alteryx
Some of the benefits of Alteryx are:
a) It has robust data preparation and transformation capabilities, which help perform complex operations such as data cleansing, parsing, joining, and aggregating efficiently.
b) It has robust data science and advanced analytics capabilities, allowing you to perform predictive, prescriptive, and spatial analytics using built-in tools and models.
c) It has high flexibility and extensibility, allowing you to customise and extend your workflows using macros, APIs, and connectors.
d) It has high performance and efficiency, allowing you to process large volumes of data and run workflows in parallel using in-memory and in-database engines.
Drawbacks of Alteryx
Some of the drawbacks of Alteryx are:
a) It includes a steep learning curve, especially for users unfamiliar with Data Analysis or programming concepts.
b) It has a high cost of ownership, as it requires a license fee for each user and each product component.
c) It has limited Data Visualisation and reporting capabilities, as it does not have a native dashboarding or storytelling feature.
d) It has limited collaboration and sharing features, as it does not have a web-based interface or a mobile app.
Take your Data Analytics skills to the next level with our Business Intelligence Reporting Courses!
Difference between Power BI and Alteryx
This section will compare Power BI and Alteryx, including product overview, features, integrations, pricing, and building business strategies.
|
Criteria |
Power BI |
Alteryx |
|
Purpose |
Business Analytics, visualisation |
Data preparation, advanced analytics |
|
Features |
Data Visualisation-focused |
Data blending, advanced analytics |
|
Integrations |
Various data sources supported |
Wide range of data sources supported |
|
Pricing |
Subscription-based, multiple plans |
Subscription-based, different licensing options |
|
Business strategies |
Interactive reports, dashboards |
Data-driven decision-making |
|
Ease of use |
User-friendly, drag-and-drop interface |
Steeper learning curve |
|
Advanced analytics |
Basic analytics, Azure ML, R support |
Predictive modelling, spatial analysis, ML |
Purpose and functionality
Power BI is primarily a Business Analytics tool developed by Microsoft. It focuses on Data Visualisation and Business Intelligence, helping users create interactive reports and dashboards using various data sources. Power BI allows users to connect multiple data sources, clean and transform data, and easily create visually appealing reports. The application's drag-and-drop interface makes it accessible to users with varying technical expertise.
On the other hand, Alteryx is a data preparation and analytics platform that goes beyond visualisation. It empowers users to blend, cleanse, and enrich data from disparate sources without extensive coding. Alteryx provides advanced analytics capabilities, including predictive modelling, spatial analysis, and Machine Learning (ML). It is favoured by data scientists and analysts who require robust data preparation and advanced analytics functionalities.
Features
Alteryx and Power BI have different features catering to various needs and preferences. Power BI has more Data Visualisation and discovery features, such as Natural Language Queries, Artificial Intelligence, dataflows, and custom visuals. Alteryx has more data preparation and analysis features, such as data cleansing, parsing, joining, aggregating, predictive, prescriptive, and spatial analytics.
BI has a user-friendly interface that lets you drag and drop data elements and choose from various visualisation options. You can also use Power Query to perform fundamental data transformations and Power Pivot to create data models. Alteryx has a graphical user interface that lets you build data pipelines using drag-and-drop tools and workflows. You can also use macros, APIs, and connectors to customise and extend your workflows.
Integrations
Alteryx and Power BI have different levels of integration with other tools and platforms. Power BI has more integrations with Microsoft products and services like Excel, PowerPoint, SharePoint, Teams, and Azure. You can import and export data and visuals between Power BI and other Microsoft applications without hassle. You can also use Azure cloud services to scale and secure your Power BI solutions.
Alteryx has more integrations with third-party tools and platforms like Tableau, Qlik, Salesforce, Amazon Web Services, and Google Cloud Platform. You can easily link and transfer data between Alteryx and other applications. You can also use cloud platforms to host and run your Alteryx workflows.
Pricing
Alteryx and Power BI have different pricing models and plans. Power BI has a free version for individual users and a low monthly fee for premium features and capacity. You can use the free version to create and publish reports to the Power BI service and the premium version to access more data sources, storage, refresh frequency, and collaboration features. You can also use the Power BI Embedded service to embed your dashboards and reports into your applications.
Alteryx has a license fee for each user and each product component. To use the respective products, you must purchase a license for Alteryx Designer, Alteryx Server, or Alteryx Cloud. You can also purchase additional licenses for Alteryx Connect, Alteryx Promote, and Alteryx Intelligence Suite to access more features and capabilities. The license fee is contingent on the number of users, the product components, and the contract duration.
Building business strategies
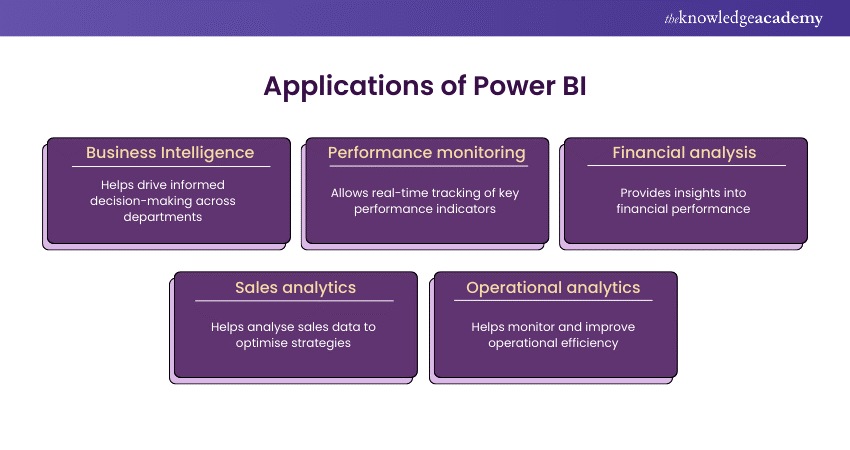
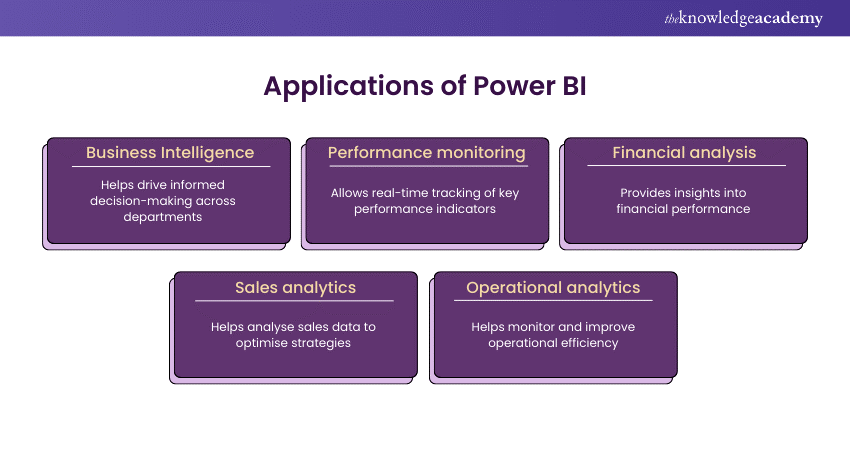
Power BI can help you build business strategies by supplying you with interactive and engaging dashboards and reports that can assist you in communicating and collaborating with your stakeholders. You can use Power BI to explore and discover patterns, trends, and anomalies in your data and to present and share your findings compellingly.
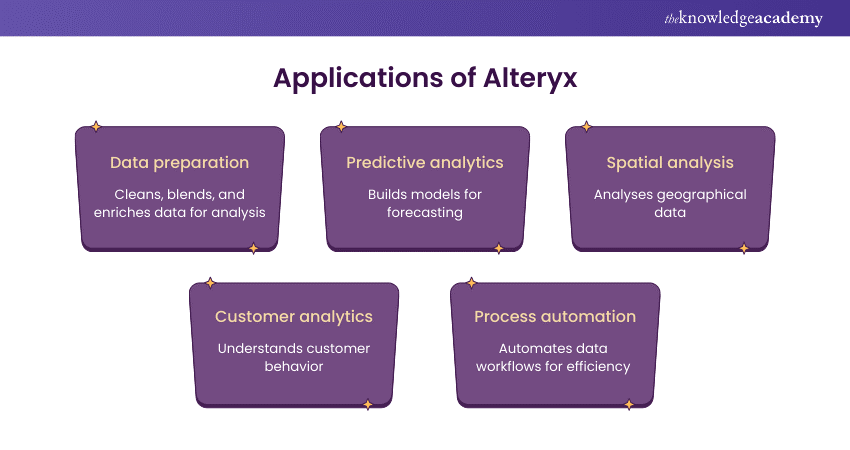
Alteryx can help you build business strategies by providing comprehensive and accurate workflows and models that can assist you in optimising and automating your processes. Alteryx can prepare and analyse your data using complex operations and models and reliably generate and validate your results.
Ease of use and learning curve
Power BI is designed to be user-friendly, with a relatively low learning curve. Its intuitive interface and drag-and-drop feature make it accessible to users with varying technical expertise, including business users and analysts.
In contrast, Alteryx has a steeper learning curve due to its comprehensive feature set and advanced capabilities. While its visual workflow interface simplifies the data preparation, mastering Alteryx's advanced analytics functionalities may require more time and training.
Advanced analytics capabilities
While Power BI offers some basic analytical features such as filtering, sorting, and calculated columns, its advanced analytics capabilities are limited compared to Alteryx. Power BI does support integrations with Azure Machine Learning and R scripts for advanced analytics, but it primarily serves as a visualisation tool.
Alteryx, on the other hand, is renowned for its advanced analytics capabilities. It provides built-in tools for predictive modelling, spatial analysis, time-series forecasting, and more. Alteryx's intuitive workflow interface allows users to create complex analytical workflows without writing extensive code, making it a preferred choice for data scientists and analysts tackling sophisticated analytical challenges.
Take your Data Visualisation skills to new heights with our Tableau Desktop Training and unleash the power of your data!
Conclusion
In conclusion, the comparison between Alteryx vs Power BI highlights the distinct strengths and applications of each tool. While Power BI excels in intuitive Data Visualisation, Alteryx stands out for its robust data preparation and advanced analytics capabilities. The choice ultimately depends on specific business needs and analytical requirements.
Elevate your Data Analysis game with our Microsoft Power BI Course and master of insightful visualisations!
Frequently Asked Questions
Can I use Alteryx and Power BI together?

Yes, Power BI and Alteryx can be used together effectively. Alteryx can be used for data preparation, blending, and advanced analytics, while Power BI can be utilised for Data Visualisation and creating interactive reports and dashboards, complementing each other's strengths.
Which tool is easier to use: Power BI or Alteryx?

Power BI is often viewed as more user-friendly, due to its straightforward drag-and-drop interface and intuitive layout. In contrast, Alteryx, despite its robustness, tends to have a more challenging learning curve because of its extensive range of features and sophisticated analytics functions.
What are the other resources and offers provided by The Knowledge Academy?

The Knowledge Academy takes global learning to new heights, offering over 3,000 online courses across 490+ locations in 190+ countries. This expansive reach ensures accessibility and convenience for learners worldwide.
Alongside our diverse Online Course Catalogue, encompassing 19 major categories, we go the extra mile by providing a plethora of free educational Online Resources like News updates, Blogs, videos, webinars, and interview questions. Tailoring learning experiences further, professionals can maximise value with customisable Course Bundles of TKA.
What is the Knowledge Pass, and how does it work?

The Knowledge Academy’s Knowledge Pass, a prepaid voucher, adds another layer of flexibility, allowing course bookings over a 12-month period. Join us on a journey where education knows no bounds.
What are the related courses and blogs provided by The Knowledge Academy?

The Knowledge Academy offers various Business Intelligence Reporting Courses, including MicroStrategy 10 Training and Microsoft Power BI Training. These courses cater to different skill levels, providing comprehensive insights into Business Intelligence Platforms.
Our Office Application Blogs cover a range of topics related to Power BI, offering valuable resources, best practices, and industry insights. Whether you are a beginner or looking to advance your Business Intelligence Reporting skills, The Knowledge Academy's diverse courses and informative blogs have you covered.
Upcoming Office Applications Resources Batches & Dates
Date
 Microsoft Power BI Course
Wed 9th Apr 2025
Wed 11th Jun 2025
Wed 6th Aug 2025
Wed 8th Oct 2025
Wed 3rd Dec 2025


 Top Rated Course


 If you wish to make any changes to your course, please


