We may not have the course you’re looking for. If you enquire or give us a call on +971 8000311193 and speak to our training experts, we may still be able to help with your training requirements.
Training Outcomes Within Your Budget!
We ensure quality, budget-alignment, and timely delivery by our expert instructors.

Are you ready to take your process improvement skills to the next level? The Lean Six Sigma Yellow Belt Exam is a critical step for professionals seeking to enhance their expertise in the field of quality management. This blog can provide a comprehensive set of Lean Six Sigma Yellow Belt Exam Questions and Answers to prepare you for success.
So, if you seek to refresh your knowledge, these carefully curated questions and answers will solidify your understanding of key concepts and methodologies. Dive into our blog to explore the essential Lean Six Sigma Yellow Belt Exam Questions and Answers and embark on your journey to becoming a certified Yellow Belt professional.
Table of Contents
1) Lean Six Sigma Yellow Belt Sample Exam Questions
a) What is Lean Six Sigma?
b) Define a control plan
c) Describe the DMAIC process
d) What is a Process Flow Diagram (PFD)?
e) What constitutes Lean methodology?
f) Explain the concept of a Control Chart
g) What is Statistical Process Control (SPC)?
h) What is the purpose of the Six Sigma methodology?
i) What is the purpose of a Fishbone Diagram (Ishikawa Diagram)?
j) What information does a Value Stream Map (VSM) convey?
2) Conclusion
Lean Six Sigma Yellow Belt Sample Exam Questions
Use these example answers with a set of practice questions to prepare for your Lean Six Sigma Yellow Belt certification. This abstract will make it possible for you to find the key points of the material and understand the principles of Lean Six Sigma.
1) What is Lean Six Sigma?
Sample Answer: The Lean Six Sigma is an approach that contains the principles of Lean. It focuses on excluding waste and improving efficiency, using Six Sigma techniques, which aim to reduce variation and defects in processes.
2) Define a control plan
Sample Answer: The control plan is a document that describes the necessary actions and procedures needed to ensure that the retained process is under control and can meet the requirements for quality. It includes data such as the key process indicators, control limits, and what contingency plans to take during the deviation.
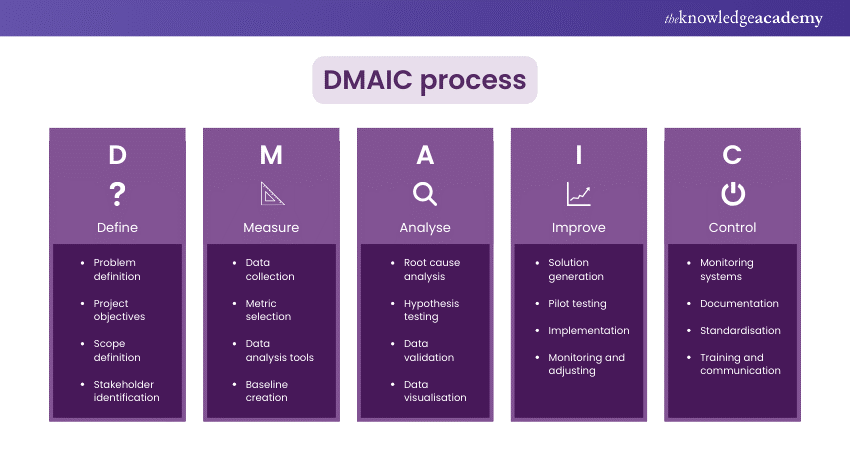
3) Describe the DMAIC process
Sample Answer: The abbreviation DMAIC mostly denotes Define, Measure, Analyse, Improve, and Control.

It shows the formal process that forms the basis of problem resolution within Six Sigma projects. In addition, it draws the focus on identification, examination, and refinement of processes for attainment of results and requirements of customers or their expectations.
Become a master of excellence with our Lean Six Sigma Master Black Belt Course - book your spot now!
4) What is a Process Flow Diagram (PFD)?
Sample Answer: A Process Flow Diagram (PFD) is the diagrammatic presentation of a process showing sequences of constituent steps, activities, and interactivity. It shows the flow of material, information, and resources through input-conversion-output.
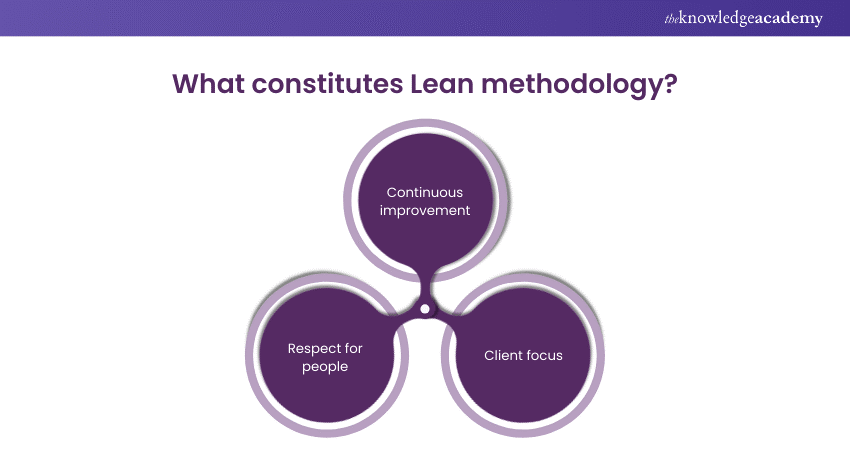
5) What constitutes Lean methodology?
Sample Answer: Lean methodology involves those principles and practices targeting value maximisation with wastes minimised in operations.

These focus on the continuous improvement of the operations, respect for people, and client focus with an aim of reaching the operational excellence level.
6) Explain the concept of a Control Chart
Sample Answer: A Control Chart is a graphic representation of a format used in the inspection of behaviour performance relative to time. Usually, it comprises plotting the data points against control limits so that one can easily recognise trends, patterns, or deviations.
7) What is Statistical Process Control (SPC)?
Sample Answer: Statistical Process Control (SPC) is a method using statistical technique for control, monitoring, and improving the process. This method involves analysing process data to distinguish between special-cause variation and the common-cause variation inherent to the process.
Enhance your organisational efficiency through our Lean Six Sigma Green Belt Course - join us today!
8) What is the purpose of the Six Sigma methodology?
Sample Answer: The Six Sigma methodology is a way of trying to improve quality by reducing variations and defects within processes. This, in turn, will improve quality, efficiency, and customer satisfaction. It is about systematically trying to look for the source of that variation and trying to eliminate the same for flawless or near-perfect results.
9) What is the purpose of a Fishbone Diagram (Ishikawa Diagram)?
Sample Answer: The purpose of a Fishbone Diagram, also known as an Ishikawa Diagram, is to visually represent the potential causes of a problem or effect. It helps identify root causes by categorising contributing factors into major categories, such as people, processes, equipment, environment, and management.
10) What information does a Value Stream Map (VSM) convey?
Sample Answer: A Value Stream Map or VSM is a graphical representation that resembles a map and describes the existing flow, main activities, inputs, output, and the other executed activities. It is very essential in pinpointing the wastes, constraints, or areas of focus on value stream map.
Conclusion
Mastering Lean Six Sigma principles at the Yellow Belt level is a crucial step towards achieving operational excellence and driving continuous improvement in organisations. By thoroughly practicing Lean Six Sigma Yellow Belt Exam Questions and Answers, individuals can solidify their understanding of key concepts. They can also enhance their problem-solving skills and pave the way for success in their Lean Six Sigma journey.
Boost your process improvement techniques with our Lean Six Sigma Yellow Belt Course - join us today!
Frequently Asked Questions
Upcoming Business Improvement Resources Batches & Dates
Date
 Lean Six Sigma Yellow Belt
Mon 16th Dec 2024
Mon 6th Jan 2025
Mon 13th Jan 2025
Mon 20th Jan 2025
Mon 27th Jan 2025
Mon 3rd Feb 2025
Mon 10th Feb 2025
Mon 17th Feb 2025
Mon 24th Feb 2025
Mon 3rd Mar 2025
Mon 10th Mar 2025
Mon 17th Mar 2025
Mon 24th Mar 2025
Mon 31st Mar 2025
Mon 7th Apr 2025
Mon 14th Apr 2025
Tue 22nd Apr 2025
Mon 28th Apr 2025
Tue 6th May 2025
Mon 12th May 2025
Mon 19th May 2025
Tue 27th May 2025
Mon 2nd Jun 2025
Mon 9th Jun 2025
Mon 16th Jun 2025
Mon 23rd Jun 2025
Mon 30th Jun 2025
Mon 7th Jul 2025
Mon 14th Jul 2025
Mon 21st Jul 2025
Mon 28th Jul 2025
Mon 4th Aug 2025
Mon 11th Aug 2025
Mon 18th Aug 2025
Tue 26th Aug 2025
Mon 1st Sep 2025
Mon 8th Sep 2025
Mon 15th Sep 2025
Mon 22nd Sep 2025
Mon 29th Sep 2025
Mon 6th Oct 2025
Mon 13th Oct 2025
Mon 20th Oct 2025
Mon 27th Oct 2025
Mon 3rd Nov 2025
Mon 10th Nov 2025
Mon 17th Nov 2025
Mon 24th Nov 2025
Mon 1st Dec 2025
Mon 8th Dec 2025
Mon 15th Dec 2025


 Top Rated Course


 If you wish to make any changes to your course, please


