We may not have the course you’re looking for. If you enquire or give us a call on 01344203999 and speak to our training experts, we may still be able to help with your training requirements.
Training Outcomes Within Your Budget!
We ensure quality, budget-alignment, and timely delivery by our expert instructors.

Day trading is a dynamic and fast-paced trading strategy that involves buying and selling Day trading is a fast-paced trading strategy that involves buying and selling financial investments within the same trading day. To succeed as a trader, you will need effective tools to make informed decisions. This is where the Best Indicators for Day Trading come into play.
In this blog, you can explore the Best Indicators for Day Trading that can help traders navigate the markets and improve their trading performance. By understanding these indicators, you'll be better equipped to make profitable trades and minimise risks.
Table of Contents
1) What is Day Trading?
2) Why do Traders need Trend Indicators?
3) Best Indicators for Day Trading
a) On-balance volume (OBV)
b) Accumulation/distribution line (ADL)
c) Volume Weighted Average Price (VWAP)
d) Average Directional Index (ADX)
e) Relative Strength Index (RSI)
f) Fibonacci Retracement
g) The Ichimoku Cloud
4) Conclusion
What is Day Trading?
Day trading is act of rapid buying and selling of securities within a span of a single trading day. Unlike long-term investing, day traders capitalise on short-term market movements to generate profits.
This strategy requires constant market monitoring and quick decision-making, as trades are usually held for a few minutes to a few hours. The goal is to take advantage of small price fluctuations to earn consistent profits.
Why do Traders need Trend Indicators?
Trend indicators are essential for day traders as they provide insights into the market's direction and momentum. These indicators help traders identify whether a market is trending upwards, downwards, or moving sideways.
By understanding the prevailing trend, traders like you can make more informed decisions on when to enter or exit the trades. Trend indicators also help in identifying potential reversals and continuations, making them crucial for developing effective trading strategies.
Ready to redefine your trading strategy? This Day Trading Course is all you will need to guide you! - register now!
Best Indicators for Day Trading
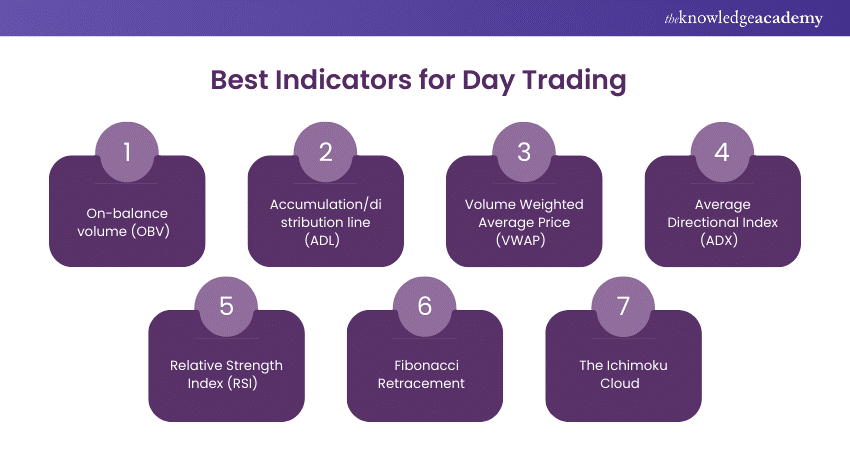
Now that you know what Day Trading and Trend Indicators are, you must be eager to know what are the Best Indicators for Day Trading! Well, then, let's explore the 7 Best Indicators for Day Trading.

1) On-balance Volume (OBV)
The on-balance volume (OBV) is a momentum indicator that relates volume to price movement. It helps the traders identify the strength of a trend by showing whether volume is flowing into or out of security.
When the OBV is rising, it indicates that buyers are in control, pushing the price higher. Conversely, a falling OBV suggests that sellers are dominating, driving the price lower. OBV is particularly useful for confirming trends and spotting potential reversals.
2) Accumulation/Distribution Line (ADL)
Another volume-based indicator is the Accumulation/Distribution Line (ADL), it shows the total amount of money that has been accumulated in or distributed out of a particular stock. It assists traders to decipher whether a specific stock is being bought or sold in the market.
An increasing ADL is always associated with buying pressure while a decreasing ADL implies selling pressure. If the ADL is used effectively, traders will get to learn the real strength or weakness of a certain trend in the market hence will help in making good trading decisions.
3) Volume Weighted Average Price (VWAP)
Among the numerous indicators that are generally used by day traders, the Volume Weighted Average Price (VWAP) is one of the most famous. It shows the average price of the security provided throughout the trading day with reference to the volume of trade. VWAP is helpful in gauging the actual average price within a given period and determining the reasonableness of a trade.
Several times it is used as a reference point, to see whether or not the current prices are high or low. Some traders use VWAP to set their buying and selling indicators, trying to buy when prices drop below the VWAP and sell when it rises above the VWAP.
4) Average Directional Index (ADX)
The Average Directional Index (ADX) is a technical indicator used to discover the strength of the current trends in trading. It was on a scale of 0 to 100, with higher results showing that there is a more apparent trend. This implies that the ADX will be greater than 20 in case of trending market and below 20 in case of ranging or non-trending market.
Like other indicators, the ADX is best used in conjunction with other indicators in order to rule out such scenarios. With knowledge of the strength of a trend, traders like you can make a sound decision regarding the trade you wish to make.
Enjoy the risks of trading but want to take it a step further? Sign up for our Cryptocurrency Trading Training to know how!
5) Relative Strength Index (RSI)
The Relative Strength Index (RSI) is a momentum oscillator. It measures the speed and change of movements of the price. It ranges from 0 to 100 and is generally used to identify overbought or oversold conditions.
An RSI above 70 indicates that a security is overbought and may require a correction, while an RSI below 30 would suggest that a security is oversold and most likely poised for a rebound. RSI is useful for spotting potential reversals and timing entries and exits in day trading.
6) Fibonacci Retracement
Fibonacci Retracement is commonly used by day traders because it helps them define potential support and resistance levels. This tool is named based on the famous Fibonacci sequence it uses to identify key levels where prices are most likely to stall or reverse in a specified direction.
Some of this levels includes 23. 6%, 38. 2%, 50%, and 61. 8%. Fibonacci Retracement helps traders determine where they might enter or exit the trade and where they should place their stop losses to control for risk convincingly.
7) The Ichimoku Cloud
The Ichimuko Cloud is another technical indicator that focuses on trends, support and resistance, as well as momentum. It is composed of several elements such as the Tenkan-sen, the Kijun-sen, the Senkou Span A, the Senkou Span B, and finally, the Kumo or cloud.
The number or price above the cloud depicts an uptrend while the same below the cloud is an indicator of downtrend. Ichimoku Cloud indicator allows the trader to determine how to enter and exit and where the whole trend of the particular market is going.
Conclusion
The Best Indicators for Day Trading are essential tools that can help traders like you make more informed decisions and improve your trading performance. This blog helps traders understand how you'll can utilise these indicators like RSI, Fibonacci Retracement, and the Ichimoku Cloud to gain valuable insights into market trends and price movements.
These indicators provide the necessary data to develop effective trading strategies and manage risks more efficiently. This will help you kickstart your journey with Day Trading.
Want to up your investment game? Sign up for our Investment Management Course to kick off your investment ventures.
Frequently Asked Questions

Yes, indicators can be effective in day trading by providing insights into the market's trends, momentum, and potential entry and exit points. However, they should be used in conjunction with other analysis methods.

The 11 am rule in trading suggests that traders should avoid making trades around 11 am, as the market tends to be less volatile and liquidity can decrease, leading to less favourable trading conditions.

The Knowledge Academy takes global learning to new heights, offering over 30,000 online courses across 490+ locations in 220 countries. This expansive reach ensures accessibility and convenience for learners worldwide.
Alongside our diverse Online Course Catalogue, encompassing 17 major categories, we go the extra mile by providing a plethora of free educational Online Resources like News updates, Blogs, videos, webinars, and interview questions. Tailoring learning experiences further, professionals can maximise value with customisable Course Bundles of TKA.

The Knowledge Academy’s Knowledge Pass, a prepaid voucher, adds another layer of flexibility, allowing course bookings over a 12-month period. Join us on a journey where education knows no bounds.

The Knowledge Academy offers Day Trading Course alongside Stock Trading. These courses cater to different skill levels, providing comprehensive insights into Investment Management.
Our Investment Training Blogs cover a range of topics related to Investment and trading, offering valuable resources, best practices, and industry insights. Whether you are a beginner or looking to advance your trading skills, The Knowledge Academy's diverse courses and informative blogs have got you covered.
Upcoming Business Skills Resources Batches & Dates
Date
 Day Trading Course
Fri 21st Feb 2025
Fri 25th Apr 2025
Fri 20th Jun 2025
Fri 22nd Aug 2025
Fri 17th Oct 2025
Fri 19th Dec 2025


 Top Rated Course


 If you wish to make any changes to your course, please


