We may not have the course you’re looking for. If you enquire or give us a call on 01344203999 and speak to our training experts, we may still be able to help with your training requirements.
Training Outcomes Within Your Budget!
We ensure quality, budget-alignment, and timely delivery by our expert instructors.

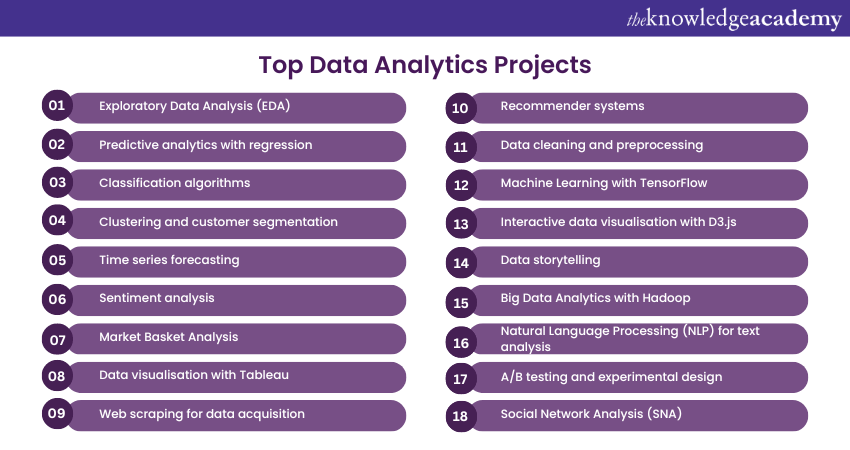
In the ever-evolving field of Data Analytics, continuous skill development is essential to stay relevant and competitive. One of the most effective ways to enhance your Data Analytics skills is through practical hands-on projects. These projects not only provide real-world experience but also demonstrate your expertise to potential employers. In this blog, we will explore the top 18 Data Analytics Projects that can significantly upgrade your skills. Read on to learn more!
Table of Contents
1) What are Data Analytics Projects?
2) Why do you need to embark on Data Analytics Projects?
3) Top Data Analytics Projects to upgrade your skills
a) Exploratory Data Analysis (EDA)
b) Predictive analytics with regression
c) Classification algorithms
d) Clustering and customer segmentation
e) Time series forecasting
f) Sentiment analysis
g) Market Basket Analysis
h) Data visualisation with Tableau
i) Web scraping for data acquisition
j) Recommender systems
4) Conclusion
What are Data Analytics Projects?
Data Analytics Projects are real-world tasks and projects which Data Analysts and professionals will do to get useful information from the data. These projects consist of different techniques and tools of analysis and processing data which is needed for taking informed decisions by businesses aiming to grow.
Data Analytics Projects comprise a variety of tasks, from data cleaning and preprocessing to complex Machine Learning and Big Data Analysis. These projects aim to uncover relationships, patterns, and associations within data.
Thereby, they offer the organisations an opportunity to refine their processes, discover fresh market opportunities, and improve their client's experience. The Data Analytics Projects possess significant potential in turning data into a strategic asset, hence it is imperative for business competence in the age of data-driven world.

Why do you need to embark on Data Analytics Projects?
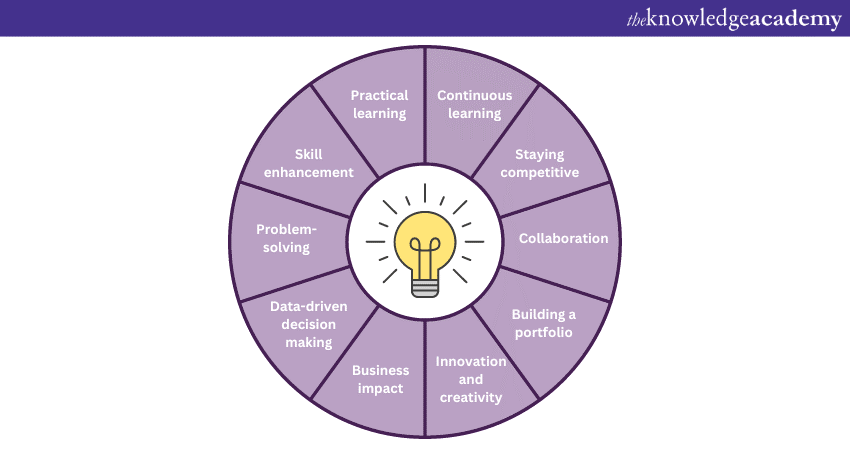
Embarking on Data Analytics Projects is essential for several compelling reasons that contribute to personal and professional growth. Here's why you need to engage in these Projects:

1) Practical learning: Data Analytics Projects offer hands-on experience, helping you apply theoretical knowledge to real-world scenarios. Through practical learning, you gain a deeper understanding of data analysis techniques and tools.
2) Skill enhancement: They enhance your Data Analytics skills, from data cleaning and preprocessing to advanced Machine Learning (ML) and big data analysis. The acquired skills make you more competent in the job market and open up diverse career opportunities.
3) Problem-solving: They involve tackling real data challenges. This fosters problem-solving abilities and hones your critical thinking skills.
4) Data-driven decision making: You will learn to make informed decisions based on data insights, driving efficiency and better outcomes.
5) Business impact: They enable businesses to identify patterns, customer behaviours, and market trends, leading to improved strategies, increased revenue, and better customer experiences.
6) Innovation and creativity: Exploring data through analytics encourages innovation, as you discover new ways to leverage data for unique solutions.
7) Building a portfolio: They provide tangible evidence of your capabilities, allowing you to create a compelling portfolio that displays your expertise to potential employers.
8) Collaboration: Many Data Analytics Projects involve teamwork, promoting collaboration and effective communication with colleagues.
9) Staying competitive: In today's data-driven world, Data Analytics skills are in high demand. Engaging in Data Analytics Projects keeps you competitive and relevant in the job market.
10) Continuous learning: Data Analytics is an ever-evolving field. By working on projects, you keep pace with emerging trends and technologies, fostering continuous learning.
Want to unlock the power of Big Data Analysis? Join our Big Data Analysis Course today!
Top Data Analytics Projects to upgrade your skills
Now that we have discussed what Data Analytics Projects are, we will delve into some of the best projects for Data Analytics for beginners and professionals. This section of the blog will delve deeper into the top Data Analytics Projects for beginners, to help you upgrade your skills and establish yourself in the job market:

1) Exploratory Data Analysis (EDA)
Exploratory Data Analysis (EDA) is a basic procedure in Data Analytics that sets the roots for the complex research. The EDA, in this case, allows Data Analysts to have a broad knowledge of the data set at disposal that is critical for taking informed steps during the data analysis process.
Data Analysis using EDA tools can point to the areas where there might be missing values, inconsistencies, or outliers. Thus, in the cleaning and preprocessing stage, the necessary steps can be taken to cleanse them.
Visualisations prepared using EDA provide us with useful information regarding the spread of data, relationships and even possible trends. This helps analysts to make data-driven decisions, discover significant patterns, and hypothesis issues for the next research.
2) Predictive analytics with regression
Predictive analytics, as the term indicates, is the primary component of data-driven decision-making. Through regression, Analysts can build models that provide future predictions by assessing past information.
It involves using predictive models to identify correlations between different elements in the data sets. Through the construction of regression models, Analysts can reveal relationships between the variables and consequently, use them to forecast releases of future outcomes.
This ability is particularly important for businesspersons and speculators in predicting sales, demand, or stock trends. Regression models not only assist in describing the relationship between dependent and independent variables but also reveal the degree of influence the independent ones have on the dependent one, facilitating the process of identifying the key drivers of the outcome of interest.
3) Classification algorithms
Classification algorithms have a very critical role in delivering solutions where data has to be sorted into predefined groups or classes. Such algorithms are broadly applied in different industries, for instance, in the medical domain, finance sector, and marketing.
In healthcare, the classifying models will be purposed to detect diseases, while in finance, they will detect fraudulent transactions. Analysing classification algorithms helps conceiving Data Analysts with sufficient skills to solve complicated problems through data components and make accurate predictions with the results.
4) Clustering and customer segmentation
Clustering is one of the unsupervised learning algorithms that tries to organise the similar instances of the data set in a group. Customer segmentation which is a clustering case study practice groups customers with the common traits together.
This expertise encourages companies to refine their marketing techniques, attract more customers, and bolster customer satisfaction. Clustering also has a place in marketing research, image processing and anomaly detection, hence it can be applied in many facets of data analytics.
5) Time series forecasting
Time series data is abundantly available across many sectors, with precise forecasting being important for achieving good decisions. Time series forecasting methods such as ARIMA and exponential smoothing are used by analysts to forecast future values from past observations. In finance, weather forecasting and supply chain management, time series forecasting provides crucial data used for making projections and resource allocation.
6) Sentiment analysis
Knowing the customer mood plays a vital role for companies that want to increase customer happiness and media image. Sentiment analysis gives the analysts the capability to measure emotions and opinions in textual form.
Sentiment analysis helps businesses to analyse the world of social media, customer reviews and feedback to know buyers' feelings about their products and services. This data helps businesses to form strategies and make data driven decisions by which they will make customer experience better.
7) Market Basket Analysis
Market Basket Analysis has become a powerful instrument for retail and e-business, because it shows linkages between the products bought at the same time. Through discovering the items that most commonly happen together, companies can improve product positioning, personalised recommendations, and cross-selling tactics already existing. Market Basket Analysis enables retailers to discover the shopping patterns of customers and thereby the sales and customer loyalty are increased.
8) Data visualisation with Tableau
Data visualisation is an indispensable skill for data analysts to communicate complex findings effectively. Tableau, with its user-friendly interface and drag-and-drop functionality, enables analysts to create stunning visualisations that capture stakeholders' attention. By presenting data in intuitive charts, graphs, and interactive dashboards, Tableau empowers analysts to convey insights concisely and influence decision-makers positively.
Want to take your Data Science skills to the next level? Join our Big Data Analytics & Data Science Integration Course now!
9) Web scraping for data acquisition
Website scraping is a powerful instrument to collect information through various online resources. Through web data scraping, marketers get the opportunity to gather a large amount of data in a short time but what is also important is to extract data from social networks where sentiment can be determined and competitor prices monitored. Through automated data extraction, analysts could reduce their time spent on extraction and eventually focus on more centralised data analysis and decision making.
10) Recommender systems
Recommender systems are extremely beneficial for businesses seeking to offer personalised User Experiences (UX). By understanding user preferences and behaviour, recommender systems suggest relevant products, movies, or content, leading to increased user engagement and customer satisfaction. This skill is crucial in e-commerce, online streaming platforms, and content-based websites to retain users and boost revenue.
11) Data cleaning and preprocessing
Data cleaning and the preparation of data are the essential steps for Data Analytics to produce clear, consistent, and trustworthy results. Represented data frequently has mistakes, anomalies, null values, and inconsistencies within it since this leads to the distortion of conclusions in the process of developing predictions. Data cleaning process, however, is carried by handling missing data, removing duplicates and dealing with outliers correctly.
Data preprocessing consists of preparing the data for analysis which involves transforming the data to a suitable form. Techniques such as scaling, one hot encoding and normalisation are carried out to bring in some harmony to the data and to make it compatible with ML algorithms. Analysts can thus clean data and perform preprocessing so that it can be relied on to be accurate, and these processes thus simply lay the foundation for further analysis.
12) Machine Learning with TensorFlow
Machine Learning (ML) is the most dominant theme in modern Data Analytics; and TensorFlow is one of the most commonly used open-source libraries for creating and training Machine Learning models. TensorFlow is a versatile and effective toolbox for constructing different models of ML among which it includes neural networks for deep learning.
Through the mastery of TensorFlow, the analysts can add the skills that are necessary in the construction of the models, training these complex ones for the tasks such as object recognition, Natural Language Processing (NLP), and the time series prediction. The TensorFlow Architecture's versatility and its integration GPU capabilities have made it an essential tool for handling large-scale Machine Learning jobs. TensorFlow empowers analysts to administer a wide gamut of data problems and take advantage of artificial intelligence’s capability.
13) Interactive data visualisation with D3.js
Data visualisation refers to the presentation of data in an engaging and interactive manner to convey insights effectively. D3.js is a prevalent JavaScript library that empowers analysts to create dynamic, interactive, and customisable data visualisations for web applications.
With D3.js, analysts can create visually stunning charts, graphs, and maps that respond to user interactions, making data exploration an immersive experience. By mastering this interactive data visualisation with D3.js, analysts can thus enhance data communication, allowing stakeholders to explore data, discover patterns, and gain valuable insights effortlessly.
14) Data storytelling
Data storytelling is the art of presenting data insights in a compelling and impressive manner to engage and influence the audience. By combining Data Analytics with storytelling techniques, analysts can convey the significance of their findings and drive action.
Data storytelling involves crafting a narrative around the data, using visualisations, anecdotes, and real-life examples to support the key messages. This skill is crucial for analysts to bridge the gap between data analysis and decision-making, enabling stakeholders to grasp the implications of the data and make informed choices. Data storytelling adds a human touch to Data Analytics, making it relatable and actionable for everyone.
15) Big Data Analytics with Hadoop
With the explosion of data in the digital age, traditional data processing tools often struggle to handle large-scale datasets. Big Data Analytics with Hadoop addresses this challenge by providing a distributed computing framework capable of processing vast amounts of data in parallel.
Hadoop's core components, Hadoop Distributed File System (HDFS) and MapReduce, enable analysts to store and process data efficiently across clusters of commodity hardware. By mastering Big Data Analytics with Hadoop, analysts can harness the power of Big Data and derive valuable insights from massive datasets. Hadoop is widely used in industries like finance, healthcare, and e-commerce for complex data analysis, recommendation systems, and predictive modelling.
Supercharge your data skills with our Big Data and Analytics Training – register now!
16) Natural Language Processing (NLP) for text analysis
Natural Language Processing or NLP, is actually a branch of Artificial Intelligence and linguistics that specifically deals with the interaction that exists between human language and computers. NLP empowers data analysts to refine and analyse huge numbers of textual data, for instance, like Social Media posts, customer reviews, and news articles.
Through the use of NLP tools such as tokenisation, part-of-speech tagging, and the named entity recognition, information from unstructured text data can be categorised and interpreted into meaningful insights. Text analysis, topic modelling, and text summarisation are the frequent applications of NLP.
17) A/B testing and experimental design
The A/B test, also known as split test, is an established method of evaluating two different variants of a web page or application. It involves measuring how they perform in terms of the impact on parameters such as user engagement, conversion rates or other key metrics.
Following this method, users are randomly assigned to either of two groups; a group that will be exposed to one version of the webpage or application while the other group is exposed to a different version. Through comparing the data, the analysts will know what impact these changes makes on user behavior and will make the data informed decision on design and optimisation.
The knowledge of experiment design and A/B testing enables analysts to run controlled experiments and draw conclusions based on experiments. They can also tweak the product or marketing strategies for better User Experience (UX).
18) Social Network Analysis (SNA)
The Social Network Analysis (SNA) technique is used to study the relationships and interactions between individuals, groups, or entities within a social network. SNA is widely applied in fields like sociology, marketing, and organisational behaviour to analyse the structure and dynamics of social relationships.
Data analysts use SNA to identify influential nodes (individuals or entities) within a network, explore patterns of communication, and understand information flow. By visualising and quantifying social networks, analysts gain insights into the connections and communication patterns that can influence decision-making, influence adoption, and foster collaboration within an organisation or community.
Unlock your data prowess with our Advanced Data Analytics Training - join today!
Conclusion
Embark on the journey to elevate your Data Analytics skills with the aforementioned best Data Analytics Projects. Each project offers unique threats and opportunities for growth. By immersing yourself in these hands-on experiences, you will not only become a proficient data analyst but also set yourself apart in a competitive job market.
Unlock the power of data with our comprehensive Data Science & Analytics Training - sign up now!
Frequently Asked Questions

Data Analytics Projects can bring a wealth of benefits to businesses. They improve decision-making, making it easier for companies to choose the right paths and strategies. Operational efficiency gets a boost, helping businesses run more smoothly and effectively. They also provide deeper insights into customer behaviors and preferences and help with more targeted marketing strategies.

The impact of a Data Analytics Project can be measured by assessing key performance indicators (KPIs) such as improved decision-making, increased revenue, cost savings, and enhanced operational efficiency. Additionally, evaluating better customer satisfaction and the achievement of project objectives and business goals provides insight into its effectiveness.

The Knowledge Academy’s Knowledge Pass, a prepaid voucher, adds another layer of flexibility, allowing course bookings over a 12-month period. Join us on a journey where education knows no bounds.

The Knowledge Academy offers various Big Data and Analytics Training, including the Hadoop Big Data Certification Training, Data Analytics with R Course and Data Science Analytics Course. These courses cater to different skill levels, providing comprehensive insights into What is Data.
Our Data, Analytics & AI Blogs cover a range of topics related to Data Analytics, offering valuable resources, best practices, and industry insights. Whether you are a beginner or looking to advance your Data Analytics skills, The Knowledge Academy's diverse courses and informative blogs have got you covered.

The Knowledge Academy takes global learning to new heights, offering over 30,000 online courses across 490+ locations in 220 countries. This expansive reach ensures accessibility and convenience for learners worldwide.
Alongside our diverse Online Course Catalogue, encompassing 17 major categories, we go the extra mile by providing a plethora of free educational Online Resources like News updates, Blogs, videos, webinars, and interview questions. Tailoring learning experiences further, professionals can maximise value with customisable Course Bundles of TKA.
Upcoming Data, Analytics & AI Resources Batches & Dates
Date
 Data Analysis and Visualisation with Python
Fri 27th Dec 2024
Fri 3rd Jan 2025
Fri 7th Mar 2025
Fri 2nd May 2025
Fri 4th Jul 2025
Fri 5th Sep 2025
Fri 7th Nov 2025


 Top Rated Course


 If you wish to make any changes to your course, please


