


 Top Rated Course

We may not have the course you’re looking for. If you enquire or give us a call on 01344203999 and speak to our training experts, we may still be able to help with your training requirements.
Descriptive Statistics: Definitions, Types, and Examples
Sienna Roberts 20 November 2024Curious about Descriptive Statistics? This branch of statistics involves summarizing and describing the essential features of a data set. In this blog, we will explore key concepts of Descriptive Statistics like mean, median, mode, and standard deviation, and how they provide insights into data trends. Let's dive into Descriptive Statistics!

Training Outcomes Within Your Budget!
We ensure quality, budget-alignment, and timely delivery by our expert instructors.
Table of Contents
Ever stared at a massive dataset, feeling overwhelmed by numbers? Making sense of raw data can be daunting, but fear not! Descriptive Statistics is your key to unlocking hidden patterns and insights. Imagine transforming a chaotic collection of numbers into a clear and compelling story.
This blog will guide you through the world of Descriptive Statistics, breaking down complex concepts into easy-to-understand terms. From understanding central tendencies to measuring dispersion, we'll explore the different types of Descriptive Statistics and provide practical examples to illustrate their applications. Get ready to transform data into actionable information!
Table of Contents
1) Understanding Descriptive Statistics
2) Types of Descriptive Statistics
3) Primary Purpose of Descriptive Statistics
4) Difference Between Univariate and Bivariate Statistics
5) Difference Between Descriptive Statistics and Inferential Statistics
6) Conclusion
Understanding Descriptive Statistics
Descriptive Statistics are tools used to summarise and describe the main features of a dataset. They provide simple summaries about the sample and the measures. Key aspects include measures of central tendency (mean, median, mode), measures of dispersion (range, variance, standard deviation), and graphical representations (histograms, bar charts).
These statistics help in understanding the distribution, central value, and variability of data, offering a clear overview without making any conclusions beyond the data. Descriptive Statistics are foundational in data analysis, setting the stage for more complex inferential statistics.

Types of Descriptive Statistics
Building on our understanding of Descriptive Statistics, let us delve into the specific types:
For all the below cases we will be considering the following sample dataset:
|
Student |
Score |
|
A |
85 |
|
B |
92 |
|
C |
78 |
|
D |
88 |
|
E |
73 |
|
F |
95 |
|
G |
80 |
|
H |
85 |
|
I |
90 |
|
J |
87 |
1) Central Tendency Measures
Central tendency measures describe the centre of a dataset, summarising the data with a single value that represents the "typical" data point. The main measures are the mean (average), median (middle value), and mode (most frequent value). These measures provide insights into the dataset's general tendency, helping identify where most data points cluster. For example, the mean gives an overall average, the median shows the midpoint, and the mode highlights the most common occurrence, each offering a different perspective on the dataset's central point.
Let us consider the above dataset.
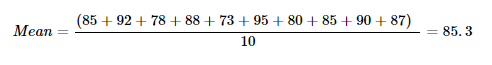
Mean: The average score is calculated by summing all the scores and dividing by the number of students.
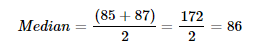
Median: The middle value when the scores are arranged in ascending order. For an even number of scores, the median is the average of the two middle numbers.
Ordered Scores: 73, 78, 80, 85, 85, 87, 88, 90, 92, 95
Mode: The most frequent score in the dataset, which is 85.
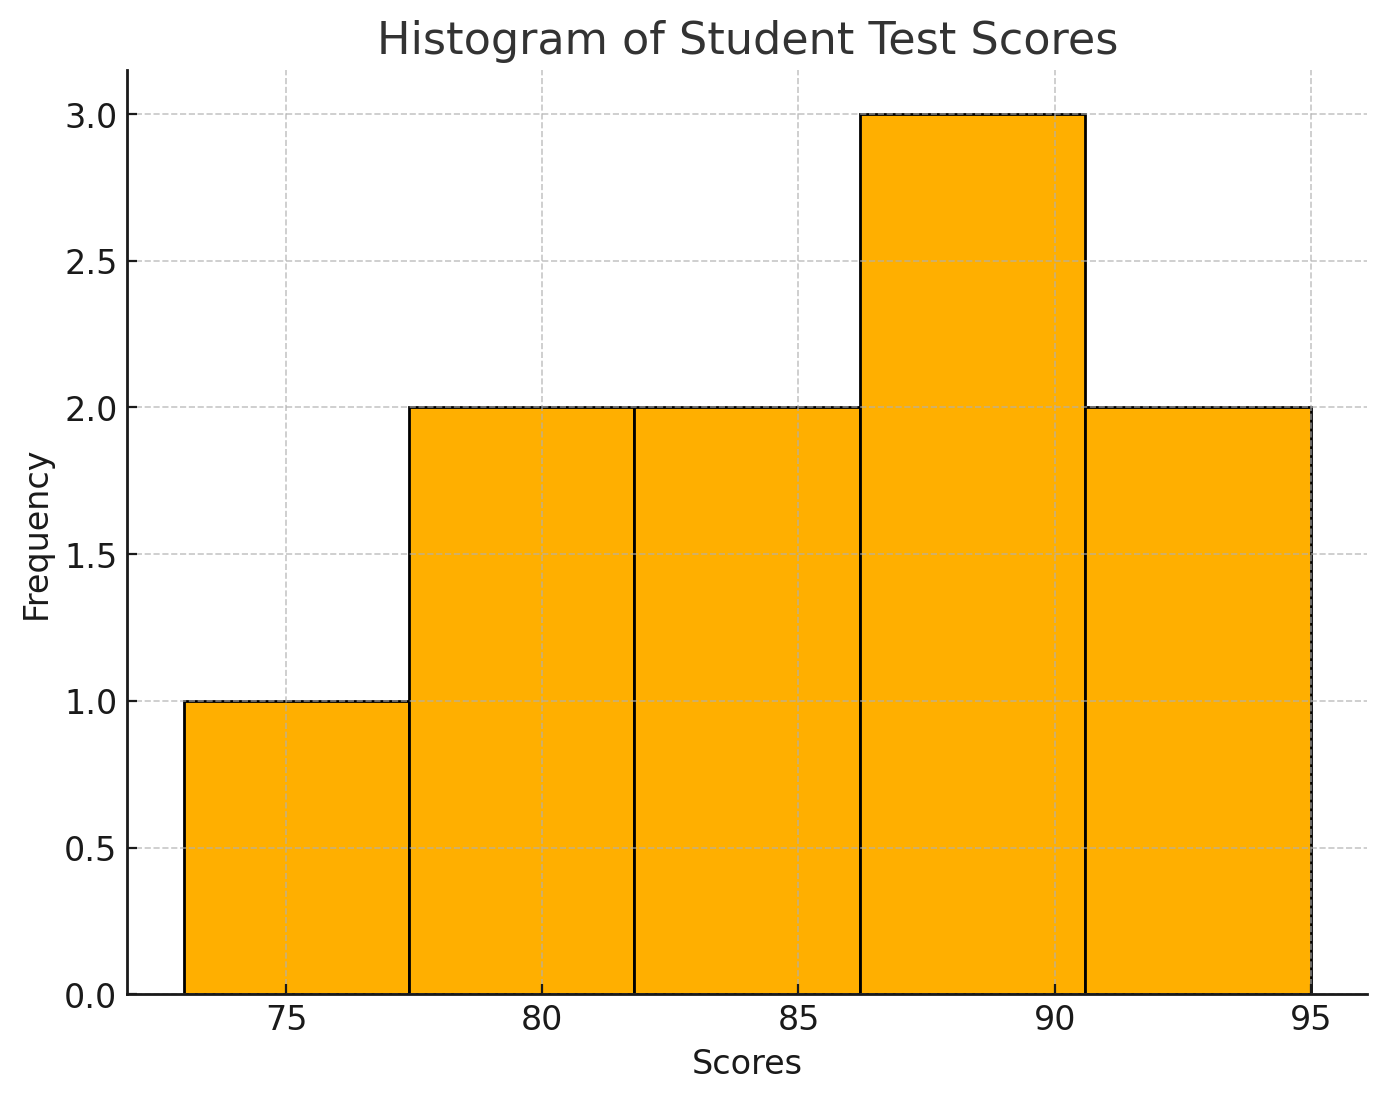
2) Distribution Analysis
Distribution analysis examines the spread and shape of data within a dataset, providing insights into patterns, trends, and potential anomalies. It involves evaluating the data's frequency distribution, using graphical tools like histograms and probability density functions.
This analysis helps in understanding whether the data is skewed, symmetric, or has outliers. It also includes looking at the data's range, quartiles, and any peaks or troughs, which can indicate important characteristics such as modality and kurtosis, essential for identifying the nature and tendencies within the data.
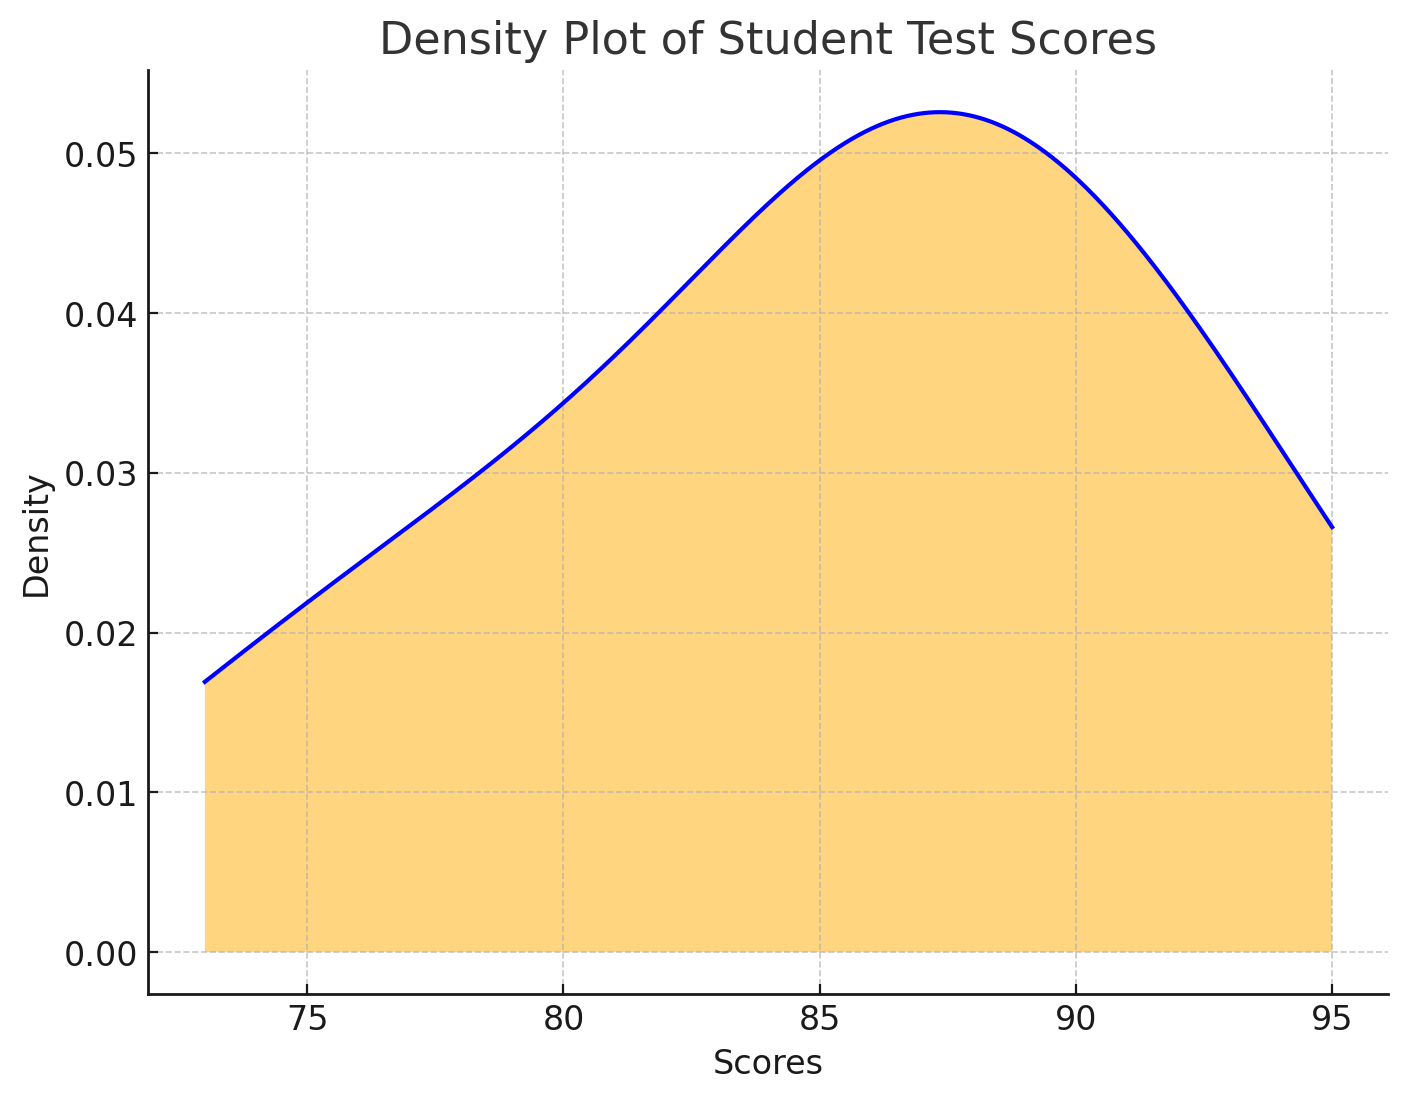
In this dataset, scores like 85, 87, and 90 occur around the middle range, with a few scores at the extremes (73 and 95). The distribution can be assessed for skewness (if the scores are more spread out on one side) or for bimodality (if there are two peaks).
Enhance quality management—Sign up for our Statistical Process Control Training today!
3) Variability Measures
Variability measures, also known as dispersion measures, quantify the extent of spread in a dataset. Key metrics include range (difference between the highest and lowest values), variance (average of squared differences from the mean), and standard deviation (square root of variance). These measures help in understanding the distribution's spread, showing how much the data points differ from the central tendency. High variability indicates that data points are spread out over a wider range of values, while low variability suggests they are closer to the mean.
Let us once again consider the previously established dataset
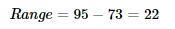
Range: The difference between the highest and lowest scores.
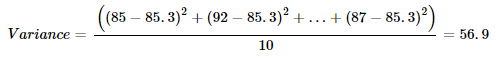
Variance: Measures the average squared deviation from the mean.
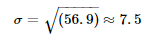
Standard Deviation (σ): The square root of the variance, providing a measure of spread in the same units as the data.
4) Univariate Descriptive Statistics
Univariate Descriptive Statistics focus on summarising and analysing a single variable within a dataset. This analysis includes calculating central tendency and variability measures, as well as using graphical representations like box plots and histograms to visualise data distribution. Univariate analysis provides a comprehensive overview of the variable's characteristics, such as its typical value, spread, and any potential anomalies or outliers. This foundational analysis is crucial for understanding the basic properties of the data before moving on to more complex multivariate analyses.
The Primary Purpose of Descriptive Statistics
The primary purpose of Descriptive Statistics is to provide a concise summary and understanding of a dataset's main characteristics. By using measures of central tendency (such as mean, median, and mode), measures of variability (including range, variance, and standard deviation), and distribution analysis, Descriptive Statistics help to simplify large amounts of data into comprehensible formats.
This enables researchers and analysts to identify patterns, trends, and anomalies within the data. Descriptive Statistics also serve as a foundation for further statistical analysis, allowing for the comparison of datasets and the identification of relationships between variables. By presenting data in a clear and organised manner, these statistics make it easier to communicate findings and support decision-making processes across various fields, such as business, healthcare, and social sciences.
Unlock the power of data with our Introduction to Statistics Course. Join now and start your journey towards data-driven decision-making!
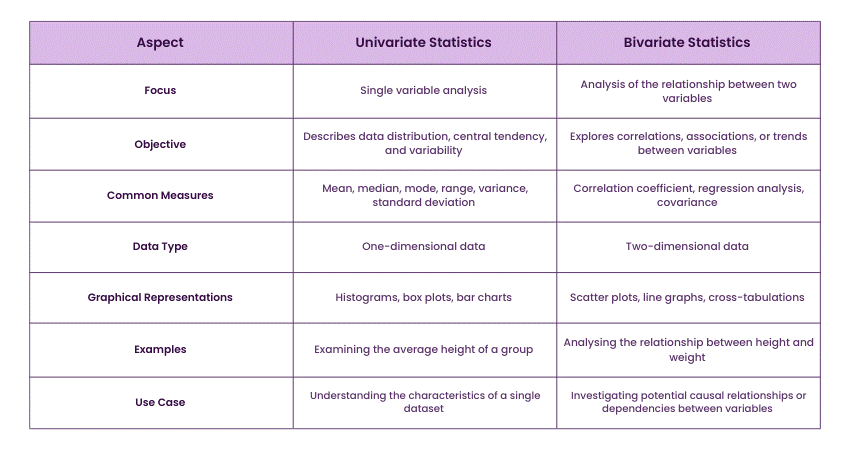
Difference Between Univariate and Bivariate Statistics
Univariate statistics involve the analysis of a single variable, focusing on its distribution, central tendency, and variability. This type of analysis provides insights into the characteristics of that specific variable, such as its mean, median, mode, range, variance, and standard deviation. It's useful for summarising and understanding the data's basic properties without considering relationships with other variables.
In contrast, bivariate statistics examine the relationship between two variables. This analysis explores how changes in one variable correlate with changes in another, often using measures like correlation coefficients, regression analysis, and scatter plots. Bivariate analysis helps identify and quantify associations, trends, or patterns between variables, providing deeper insights into potential causal relationships or dependencies. While univariate analysis focuses solely on individual variable properties, bivariate analysis seeks to understand interactions between pairs of variables.
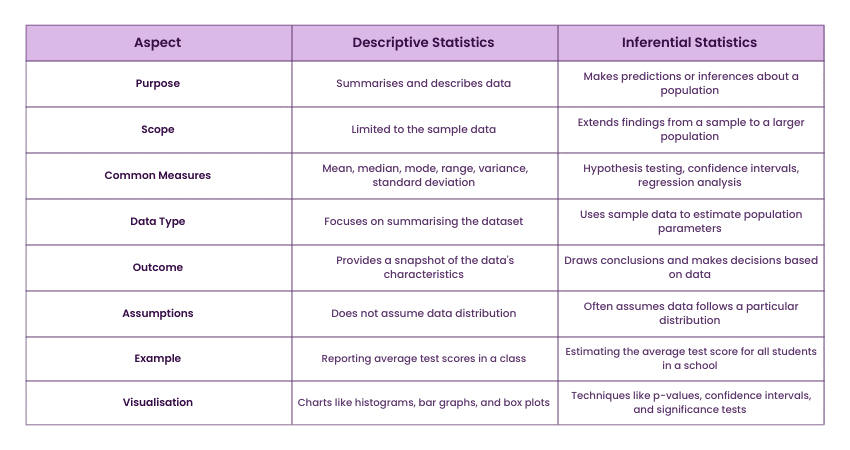
Difference Between Descriptive Statistics and Inferential Statistics
Descriptive Statistics and inferential statistics serve different purposes in data analysis. Descriptive Statistics focus on summarising and describing the main features of a dataset. They provide simple summaries and visualisations, such as mean, median, mode, range, and standard deviation, to help understand the basic characteristics of the data. These statistics do not involve generalisations beyond the data at hand.
Inferential statistics, on the other hand, involve making predictions or inferences about a population based on a sample. This branch of statistics uses methods such as hypothesis testing, confidence intervals, and regression analysis to draw conclusions and make decisions. Inferential statistics allow researchers to estimate population parameters and test theories, even when data from the entire population is not available. While Descriptive Statistics offer a snapshot of the data, inferential statistics extend that snapshot to make broader conclusions and predictions.
Maximise efficiency and profits—Join our Mathematical Optimisation for Business Problems Course and master the art of optimal decision-making!
Conclusion
Descriptive Statistics are your first step in understanding data. By mastering measures of central tendency, dispersion, and distribution, you can extract meaningful insights. Remember, effective data analysis begins with a solid grasp of Descriptive Statistics. Now, go forth and explore your data!
Advance your career—Register for our Business Analyst Courses today and become a data-driven decision-maker.
Frequently Asked Questions
What are the Requirements for Descriptive Statistics?

Descriptive Statistics require data collection, organisation, and summary. They need accurate measurements of central tendency, variability, and distribution to effectively describe and summarise the dataset's main characteristics.
What do Descriptive Statistics Not Tell us?
Descriptive Statistics do not provide information about cause-and-effect relationships, nor do they offer predictions or inferences about a population based on a sample. They solely summarise and describe the data without drawing broader conclusions.
What is the Main Concern of Descriptive Statistics?
The main concern of Descriptive Statistics is to summarise and describe the essential features of a dataset in a clear and understandable manner, highlighting patterns, trends, and anomalies without making generalisations beyond the observed data.
What are the Other Resources and Offers Provided by The Knowledge Academy?
The Knowledge Academy takes global learning to new heights, offering over 30,000 online courses across 490+ locations in 220 countries. This expansive reach ensures accessibility and convenience for learners worldwide.
Alongside our diverse Online Course Catalogue, encompassing 17 major categories, we go the extra mile by providing a plethora of free educational Online Resources like News updates, Blogs, videos, webinars, and interview questions. Tailoring learning experiences further, professionals can maximise value with customisable Course Bundles of TKA.
What is The Knowledge Pass, and How Does it Work?
The Knowledge Academy’s Knowledge Pass, a prepaid voucher, adds another layer of flexibility, allowing course bookings over a 12-month period. Join us on a journey where education knows no bounds.
What are the Related Courses and Blogs Provided by The Knowledge Academy?
The Knowledge Academy offers various Business Analyst Courses, including the Certified Business Analyst Professional (CBA-PRO) Course, Introduction to Statistics Course and the Introduction to Business Analytics Training. These courses cater to different skill levels, providing comprehensive insights into Standard Deviation in Statistics.
Our Business Analysis Blogs cover a range of topics related to Statistics, offering valuable resources, best practices, and industry insights. Whether you are a beginner or looking to advance your Business Analyst skills, The Knowledge Academy's diverse courses and informative blogs have got you covered.
Upcoming Business Analysis Resources Batches & Dates
Date
 Statistics Course
Statistics Course
Fri 20th Dec 2024
Statistics Course
Fri 21st Feb 2025
Statistics Course
Fri 25th Apr 2025
Statistics Course
Fri 20th Jun 2025
Statistics Course
Fri 22nd Aug 2025
Statistics Course
Fri 17th Oct 2025
Statistics Course
Fri 19th Dec 2025
 If you wish to make any changes to your course, please


