We may not have the course you’re looking for. If you enquire or give us a call on 01344203999 and speak to our training experts, we may still be able to help with your training requirements.
We ensure quality, budget-alignment, and timely delivery by our expert instructors.

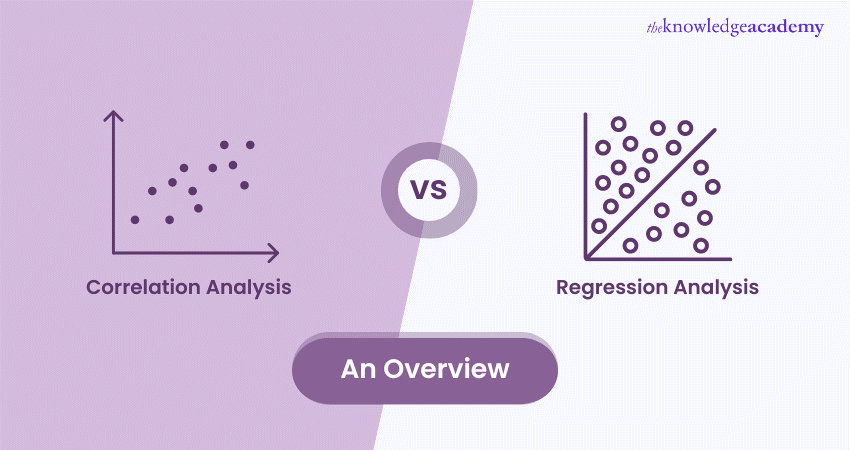
In the domain of Statistical Analysis, Correlation and Regression Analysis play pivotal roles in unravelling the intricate relationships within datasets. These are statistical methods used to analyse the relationships between variables, providing various types of information. However, these methods cannot be used interchangeably to handle data. So, which one should you use? This blog will provide a comprehensive overview of the Difference Between Correlation and Regression Analysis, shedding light on their unique purposes, applications, and implications.
Table of Contents
1) What is Correlation Analysis?
2) An overview of Regression Analysis
3) What's the Difference Between Correlation and Regression Analysis?
4) When to use Correlation vs Regression Analysis?
5) Conclusion
What is Correlation Analysis?
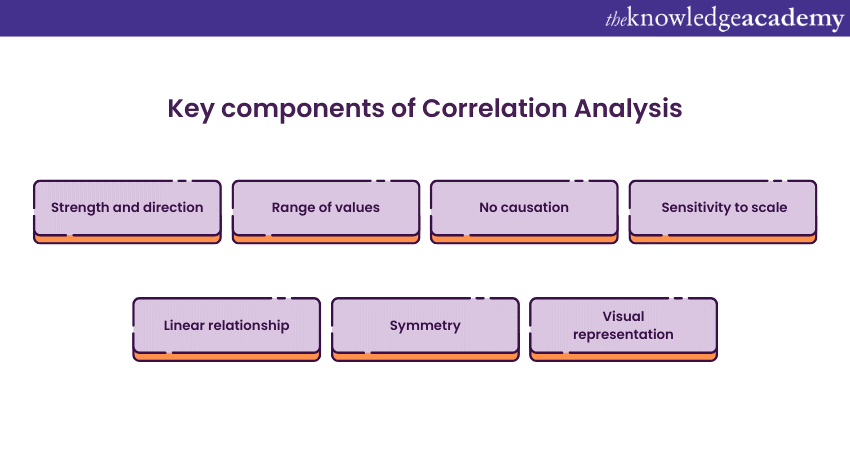
Correlation Analysis is a statistical method used to evaluate the strength and direction of the linear relationship between two quantitative variables. In other words, it helps to assess how changes in one variable are associated with changes in another variable. The result of a Correlation Analysis is expressed as a Correlation coefficient, which quantifies the degree of Correlation between the variables. Key components of Correlation Analysis include the following:

1) Strength and direction: Correlation Analysis measures the strength and direction of the linear relationship between two variables. The Correlation coefficient indicates the degree of association, with positive values signifying a positive relationship, negative values indicating a negative relationship, and zero implying no linear association.
2) Range of values: The Correlation coefficient ranges from -1 to +1. A coefficient of +1 signifies a perfect positive Correlation, -1 denotes a perfect negative Correlation, and 0 indicates no linear Correlation.
3) No causation: Correlation does not imply causation. Even if two variables are strongly correlated, it does not necessarily mean that changes in one variable cause changes in the other. Correlation reflects association, not causality.
4) Sensitivity to scale: Correlation is sensitive to the scale of measurement of the variables. It remains the same regardless of the units used, making it a scale-free measure.
5) Linear relationship: Correlation Analysis assumes a linear relationship between the variables. If the relationship is nonlinear, the Correlation may not accurately reflect the association.
6) Symmetry: The Correlation between variable X and Y is the same as the Correlation between Y and X. It is a symmetric measure of association.
7) Visual representation: Correlation is often visually represented using scatterplots, where the pattern of points can provide insights into the strength and direction of the relationship.
An overview of Regression Analysis
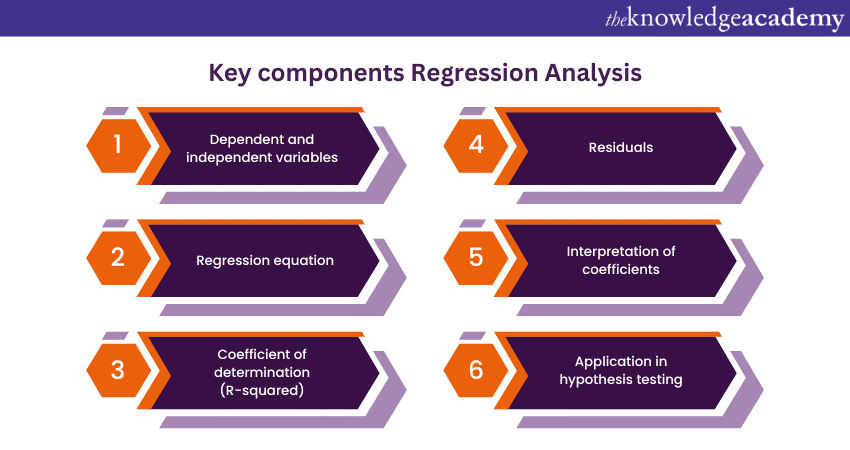
What is Regression Analysis? It is a statistical method used to examine the relationship between one dependent variable and one or more independent variables. The goal of this method is to understand how changes in the independent variables are associated with changes in the dependent variable. It is widely used in various fields, including economics, finance, biology, and social sciences, to model and analyse relationships within data. The key components of Types of Regression Analysis include the following:

1) Dependent and independent variables: In a Regression Analysis, there is a dependent variable (the outcome or response variable) and one or more independent variables (predictor variables). The aim is to model how the independent variables impact the dependent variable.
2) Regression equation: The Regression equation is a mathematical formula that represents the relationship between the variables. It allows predictions of the dependent variable based on given values of the independent variables.
3) Coefficient of determination (R-squared): R-squared is a measure of how well the Regression model explains the variability in the dependent variable. It ranges from 0 to 1, with a higher value indicating a better fit of the model to the data.
4) Residuals: Residuals are the differences between the observed values of the dependent variable and the values predicted by the Regression equation. Analysing residuals helps assess the accuracy of the model.
5) Interpretation of coefficients: The coefficients in the Regression equation indicate the magnitude and direction of the impact of the independent variables on the dependent variable.
6) Application in hypothesis testing: Regression Analysis facilitates hypothesis testing, allowing researchers to determine the significance of the relationships between variables.
Ready to master Regression Analysis? Join our Regression Analysis Training now!
What’s the Difference Between Correlation and Regression Analysis?
While Correlation and Regression both deal with the relationship between variables, they serve different purposes and have distinct characteristics. Here are the key differences between Correlation Analysis and Regression Analysis:
Purpose
Correlation Analysis measures the strength and direction of a linear relationship between two variables. It indicates how much one variable change when the other changes but does not imply causation. In contrast, Regression Analysis aims to model the relationship between a dependent variable and one or more independent variables. Regression provides a predictive model to estimate the value of the dependent variable based on the values of the independent variables.
Output
In Correlation Analysis, the result is a Correlation coefficient (e.g., Pearson's Correlation coefficient) that ranges from -1 to +1. The sign indicates the direction of the relationship, and the magnitude represents the strength.
On the other hand, in Regression Analysis, the result includes a Regression equation that expresses the mathematical relationship between the variables. This equation can be used to predict the value of the dependent variable.
Variables
Correlation involves two variables, often referred to as X and Y, and examines the association between them. In comparison, Regression Analysis Includes both dependent (response) variables and one or more independent (predictor) variables. It models the impact of the independent variables on the dependent variable.
Causation
Correlation indicates the degree and direction of association but does not provide information about causation. It does not imply that changes in one variable cause changes in the other. Meanwhile, Regression Analysis can identify relationships and make predictions. Also, it does not establish causation, and additional research is needed to confirm causal relationships.
Mathematical representation
Correlation is expressed by a single value (Correlation coefficient). On the contrary, Regression is represented by an equation (Regression equation) that includes coefficients for each independent variable.
Interpretation
Correlation describes the degree of linear association between two variables. While Regression provides insights into how changes in independent variables affect the dependent variable.
Use cases
Correlation is used to identify and measure the strength of relationships between variables. Commonly used in exploratory data analysis. On the other hand, Regression is applied when the goal is to predict or model the behaviour of the dependent variable based on known values of the independent variables.
Understanding the Difference Between Correlation Analysis and Regression Analysis is crucial for researchers and analysts to choose the appropriate analysis method based on their objectives and the nature of their data.
Ready to excel in the world of accounting? Join our Accounting Masterclass and gain the skills to thrive in this dynamic field!
When to use Correlation vs Regression Analysis?
Deciding whether to use Correlation or Regression Analysis depends on the nature of your research question, the type of data you have, and your specific goals. Here are guidelines on when to use each method:
Use Correlation when
You can use Correlation Analysis when faced with the following circumstances:
1) Objective is to measure association: Use Correlation when your primary interest is to quantify the strength and direction of the linear relationship between two variables.
2) No need for prediction: Choose Correlation when you don't need to make predictions or model the relationship. It provides a descriptive measure without establishing causation.
3) Simple relationship assessment: Opt Correlation for a simple assessment of whether and how two variables are related. It's a useful initial step in data exploration.
4) Variables are numeric: Correlation is suitable when both variables are numeric. It measures the degree of linear association between quantitative variables.
Use Regression when
You can use Regression Analysis when faced with the following circumstances:
1) Predictive modelling is required: Choose Regression Analysis when your goal is to build a predictive model. If you want to estimate or predict the value of one variable based on the values of others, Regression is the appropriate choice.
2) Understanding cause and effect: If you are interested in exploring potential cause-and-effect relationships between variables, Regression Analysis allows you to model how changes in one variable affect another.
3) Multiple independent variables: When you have multiple independent variables influencing a dependent variable, use multiple Regression. It helps account for the combined effects of several factors.
4) Quantifying relationships: Regression is useful when you want to quantify the relationship between variables. The Regression equation provides coefficients that indicate the impact of each independent variable on the dependent variable.
5) Testing hypotheses: If you have specific hypotheses to test regarding the relationship between variables, Regression Analysis allows for hypothesis testing on the significance of coefficients.
Learn the fundamentals of regression analysis! Download the Regression Analysis PDF now and gain the knowledge you need to enhance your data-driven decisions.
Conclusion
Understanding the Difference Between Correlation and Regression Analysis is essential for researchers, analysts, and Data Scientists. Delve into the key Distinctions Between Correlation and Regression, helping you understand when to apply each technique effectively. Both techniques offer valuable insights into the relationships between variables, yet they serve distinct purposes and provide different types of information.
Shape your financial future with our Financial Modelling Training now!
Frequently Asked Questions
What are the Other Resources and Offers Provided by The Knowledge Academy?

The Knowledge Academy takes global learning to new heights, offering over 3,000 online courses across 490+ locations in 190+ countries. This expansive reach ensures accessibility and convenience for learners worldwide.
Alongside our diverse Online Course Catalogue, encompassing 19 major categories, we go the extra mile by providing a plethora of free educational Online Resources like News updates, Blogs, videos, webinars, and interview questions. Tailoring learning experiences further, professionals can maximise value with customisable Course Bundles of TKA.
Upcoming Accounting and Finance Resources Batches & Dates
Date
 Payroll Course
Fri 30th May 2025
Fri 15th Aug 2025
Fri 26th Sep 2025
Fri 31st Oct 2025


 Top Rated Course


 If you wish to make any changes to your course, please


