We may not have the course you’re looking for. If you enquire or give us a call on 01344203999 and speak to our training experts, we may still be able to help with your training requirements.
Training Outcomes Within Your Budget!
We ensure quality, budget-alignment, and timely delivery by our expert instructors.
Welcome to the world of digital insights and data-driven decision-making! In this blog, we unravel the power of Google Analytics for Beginners. Whether you are a business owner, marketer, or simply curious about understanding online performance, this journey is designed to demystify the intricacies of data analysis. From setting up your account to deciphering audience behaviour, we will equip you with the foundational knowledge to navigate the Google Analytics domain.
Google Analytics is free software to track user behaviour on your website. Read more about Google Analytics for Beginners and join us as we embark on a transformative exploration into harnessing the potential of Google Analytics for Beginners.
Table of Contents
1) What is Google Analytics?
2) Why Should You Use Google Analytics?
3) Navigating the GA4 interface
4) Key Concepts in Google Analytics
5) Setting up Goals and Conversions
6) Analysing Audience Data
7) Using Custom Reports and Dashboards
8) Advanced Features and Best Practices
9) Conclusion
What is Google Analytics?
Websites are essential hubs for businesses, organisations, and individuals to connect with their audiences. However, more than simply having a website is required; understanding how your website performs and how users interact with it is crucial for making informed decisions that drive growth and success. This is where Google Analytics comes into play.
Google Analytics is a valuable web analytics tool offered by Google that provides insights into various aspects of your website's performance. It enables you to track and analyse user behaviour, traffic sources, conversion rates, etc. With these insights, you can fine-tune your website, optimise user experience, and tailor your marketing strategies for maximum effectiveness.
Google Analytics lets you understand how many users visit your website, where they come from, and which pages they visit. This data is crucial for evaluating your website's overall reach and popularity.
The tool helps you track user interactions on your site, such as clicks, page views, and session durations. This information reveals which parts of your website are engaging and which may need improvement.
Conversion refers to a specific action you want users to take on your website, such as signing up for a newsletter or filling out a contact form. Google Analytics enables you to track these actions and measure the effectiveness of your call to action.
You can better understand your website visitors through demographic data, interests, and devices used to access your site. This information helps you tailor your content and design to match your audience's preferences.
Google Analytics demonstrates to you where your website traffic comes from. Whether it's organic search, social media, paid ads, or referrals from other websites, this information helps you align your marketing strategies on the most effective channels.
Why Should You Use Google Analytics?
Google Analytics is an incredibly powerful tool for tracking website metrics, provided by the leader in search engines—and it’s completely free.
While setting it up requires some effort, numerous online tutorials and resources can guide you through the process. Once Google Analytics is linked to your site, you can access the dashboard to begin monitoring your data. Note that it doesn’t retroactively gather data, so you’ll need to allow time for data collection.
Google Analytics enables you to move beyond guesswork, offering insights into which pages and content perform well or need improvement, empowering you to make data-driven decisions.
Navigating the GA4 interface
Upon logging into your GA4 account, you will be greeted by the dashboard. This dashboard serves as a snapshot of your website's performance and key metrics. It displays an overview of essential data, such as total users, sessions, and conversion rates. The dashboard quickly captures your website's health and recent trends.
GA4 is all about data, and understanding the fundamental metrics and dimensions is crucial. Dimensions provide context to metrics by categorising the data. Examples of sizes include traffic sources, devices used, and user locations. By combining metrics and measurements, you can gain more profound insights into user behaviour and interactions on your website.
The reporting interface is where the real magic happens. It is where you can delve into various reports that provide insights into different aspects of your website. Some key reports in GA4 include:
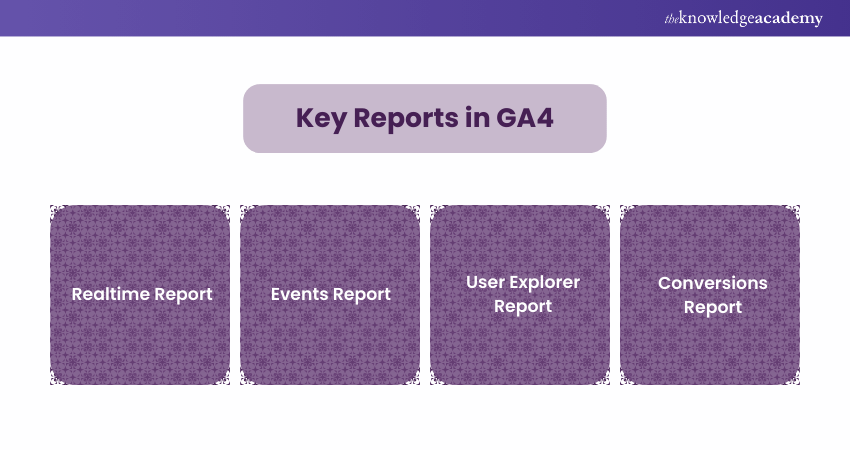
a) Realtime Report: This report shows you live data about current user activity on your website.
b) Events Report: Events are user interactions, such as clicks, downloads, and video views. The Events report helps you understand users' actions on your site.
c) User explorer Report: This report allows you to track individual user journeys, providing a detailed understanding of how users navigate your site.
d) Conversions Report: Here, you can track and analyse your defined conversion goals, gaining insights into what drives user engagement and actions.
One of GA4's strengths is its flexibility. You can make custom reports that are tailored to your needs. Custom reports allow you to combine different metrics and dimensions to focus on the insights that matter most to your business. Dashboards provide a visual snapshot of your chosen metrics, helping you monitor critical data briefly.
GA4 incorporates machine learning to provide insights automatically. These AI-driven insights can help you identify trends, opportunities, and potential issues you might not have noticed. For example, it might highlight a particular page experiencing a sudden drop in engagement, prompting you to investigate further.
Google Analytics allows for collaboration within the platform. You can provide access to specific team members or stakeholders, controlling their level of access. This is particularly useful when working with a team to analyse information and make informed decisions. Additionally, you can share reports and dashboards with colleagues or superiors to keep everyone on the same page.
Take your Digital Marketing skills to the next level with our Digital Marketing Courses – join now!
Key Concepts in Google Analytics
Events are user interactions with your website. They can include actions like clicks, downloads, form submissions, and video views. Events provide valuable insights into how users engage with your content and what drives their interactions.
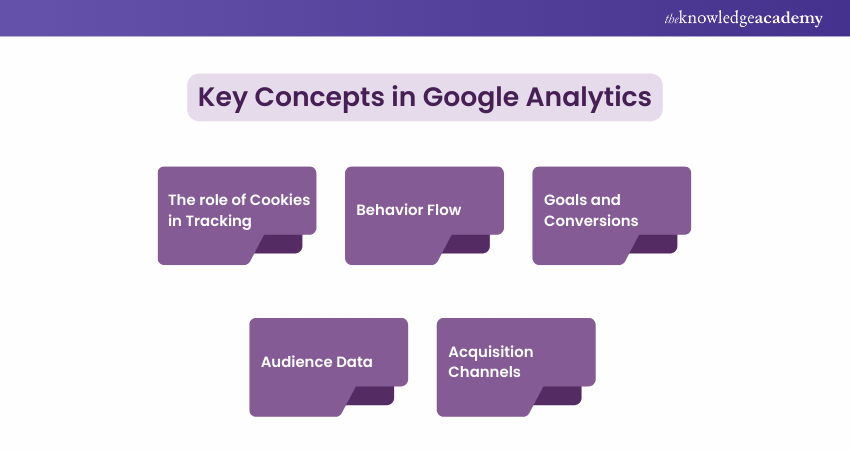
Users represent unique visitors to your website. Google Analytics uses cookies to track users, allowing you to understand the number of individual people who have accessed your site.
A session is a single visit to your website, encompassing a series of interactions by a user. Sessions are bounded by a specific timeframe, usually 30 minutes of inactivity or the end of the day. They help you measure user engagement within a defined period.
Cookies are small data stored on users' devices that enable websites to remember certain information about them. In Google Analytics, cookies are pivotal in tracking user interactions, identifying unique users, and attributing their actions to specific sessions. This tracking lets you collect valuable user behaviour, preferences, and navigation path data.
Google Analytics 4 (GA4) represents a significant evolution from its predecessor, Universal Analytics. While the core principles remain the same, GA4 introduces enhanced tracking capabilities, user-centric reporting, and a focus on event-driven data collection. GA4 is designed to provide a more precise understanding of user behaviour across various devices and platforms, making it well-suited for today's diverse digital landscape.
Goals and conversions are essential components of Google Analytics that permit you to gauge the success of your website. Goals are specific actions you want users to take, such as signing up for a newsletter or completing a purchase. Conversions occur when users meet these actions. By defining goals and tracking conversions, you can assess the effectiveness of your website's call-to-actions and marketing campaigns.
Understanding your website's audience is crucial for tailoring your content and marketing strategies. Google Analytics provides insights into demographic data (age, gender, location), interests, and devices used by your visitors.
Acquisition channels refer to the sources through which users arrive at your website. These sources include organic search, direct traffic, social media, referral links, and paid advertisements. Analysing acquisition channels helps you allocate resources effectively and optimise your marketing efforts based on the platforms that drive the most traffic and conversions.
The behaviour flow report visualises the path users take through your website, showing how they navigate from one page to another. This report is invaluable for identifying popular user paths, potential drop-off points, and areas where users may encounter difficulties. Analysing behaviour flow guides you in improving user experience and optimising navigation pathways.
Setting up Goals and Conversions
In web analytics, setting up goals and tracking conversions is crucial for understanding the effectiveness of your online efforts. Goals represent specific actions you want users to take on your website, such as signing up for a newsletter or completing a purchase. These goals guide your analysis, helping you measure success and optimise user interactions.
Defining goals is the first step. Whether it’s tracking destination pages, session duration, pages per session, or event interactions like clicks and downloads, goals should align with your website’s purpose and business objectives. Clearly defined goals create a focal point for your analytics journey.
Conversions occur when users complete the actions you’ve set as goals, marking key successes. The conversion rate, which compares the number of conversions to total visitors, serves as a vital metric for gauging how effectively your website drives user engagement.
Google Analytics offers detailed reports on goal-related insights. The Goal Overview provides a snapshot of conversion rates, while Funnel Visualisation reveals user journeys and potential friction points. The Goal Flow report traces user paths from initial interaction to goal completion, offering a clear view of user behaviour.
Regularly revisiting and adjusting goals ensures they remain relevant and aligned with evolving business strategies. Incorporating goals and conversions into your Google Analytics strategy transforms raw data into actionable insights, providing a comprehensive understanding of user engagement.
Transform your marketing with data-driven strategies — sign up for our Data-Driven Marketing Course today!
Analysing Audience Data
In web analytics, setting up goals and conversions holds the key to understanding the efficiency of your online endeavours. Goals are clear actions you want users to take on your website, such as signing up for a newsletter or completing a purchase. These goals serve as compass points, guiding your analysis towards measuring success and optimising user interactions.
Defining goals is the first step. Whether it is tracking destination pages, duration of visits, pages viewed per session, or event interactions like clicks and downloads, these goals align with your website's purpose and your business aspirations. With clarity in your dreams, you establish a focal point for your analytics journey.
Conversions, the fruition of your defined goals, are moments of triumph. They mark instances when users complete the actions you have set out to achieve. The conversion rate, a critical metric, quantifies the success of these actions by comparing the number of conversions to the total number of visitors. It is a tangible indicator of how effectively your website compels users to engage in desired behaviours.
Navigating the terrain of goal-related insights, Google Analytics provides comprehensive reports. The Goal Overview presents a snapshot of conversion rates for each goal, offering a quick evaluation of goal achievements.
The Funnel Visualisation, particularly useful for multiple-step destination goals, unveils the user journey and highlights potential friction points. Meanwhile, the Goal Flow report visually traces users' pathways, mapping their trajectory from initial interaction to goal completion. This report paints a vivid picture of user behaviour, aiding your understanding of common paths to conversions.
Refinement is the name of the game. Regularly revisit and adjust your goals to reflect evolving business strategies and changing user dynamics. As you glean insights from goal reports, you will uncover user pain points and areas for optimisation. Adapting your goals ensures that you track actions that are relevant and impactful in achieving your website's objectives.
Incorporating goals and conversions into your Google Analytics strategy transforms raw data into strategic insights. Setting up goals tailored to your website's mission and monitoring conversions gives you a holistic understanding of user engagement.
Analysing audience data
Demographics is your starting point, revealing the age, gender, and geographical location of your audience. This snapshot shapes your approach, enabling you to tailor your messages to resonate with these segments. For instance, understanding that your audience primarily consists of young professionals might inspire content with a modern and dynamic tone.
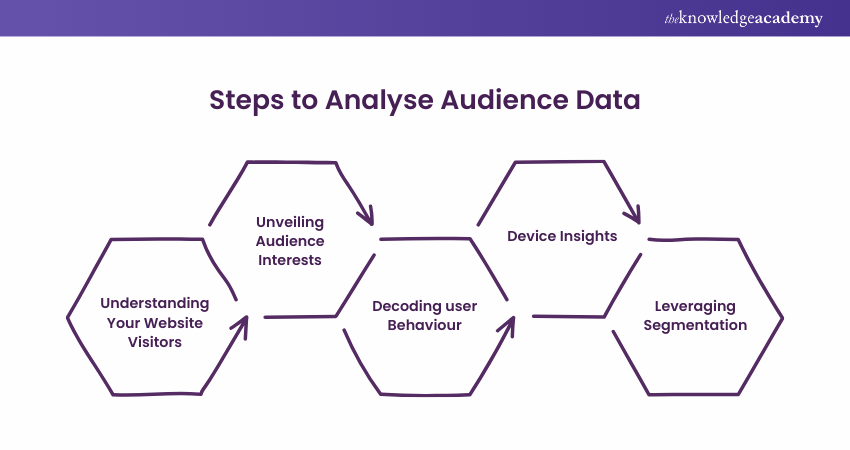
Interesting data lifts the veil on your visitors' passions beyond your website. This knowledge lets you curate content that aligns with their hobbies and preferences. If you discover a keen interest in travel, creating travel-themed articles or offering travel-related products can spark deeper engagement.
Then comes the art of decoding User Behaviour – a map of how users navigate your website. The behaviour flow report unveils their digital footsteps, spotlighting popular routes and potential drop-off points. This insight becomes your compass for refining navigation and enhancing user experience.
Device Insights are a critical lens through which to view your audience. Knowing whether they are browsing from desktops, tablets, or mobile phones is pivotal for responsive design and a seamless browsing experience. If mobile traffic is substantial, ensuring mobile-friendly pages becomes paramount.
Segmentation enables you to zoom in on specific slices of your audience. Dividing them based on demographics, behaviours, or sources helps you personalise strategies for various user groups. Personalisation, in turn, breathes life into your content and campaigns.
As trends emerge from the data, you will spot hidden Opportunities. A spike in traffic from a particular region might inspire localised content, or a surge in interest in a specific topic could guide your content creation strategy.
Crucially, audience data fuels Decision Making. Every tweak and every transformation is grounded in these insights. From overhauling your content strategy to optimising user journeys, the steps you take are guided by the data compass.
Using Custom Reports and Dashboards
Custom Reports allow you to handpick the metrics and dimensions that most matter to you. Instead of sifting through a sea of data, you can create a report showcasing specific aspects of your website's performance.
For instance, you might create an account that highlights the conversion rates of a particular product category, providing a laser-focused view of its success. Custom reports enable you to zoom in on the insights that drive your decision-making, making the analytical process more efficient and actionable.
On the other hand, dashboards take customisation a step further by offering a holistic snapshot of your chosen metrics and reports. Think of a dashboard as your personalised control centre, displaying key performance indicators, trends, and user behaviour patterns all in one place. With a well-crafted dashboard, you can monitor the health of your website briefly, facilitating quick assessments and allowing you to pivot strategies as needed.
The beauty of custom reports and dashboards lies in their flexibility. They can cater to various roles and objectives within your team. A marketing professional might focus on acquisition channels and campaign performance, while a content strategist might be interested in audience engagement and behaviour flow. By tailoring reports and dashboards to different stakeholders, you create a cohesive, data-driven environment that empowers everyone to make informed decisions.
Advanced Features and Best Practices
Beyond the default set of dimensions and metrics, custom dimensions and metrics empower you to track data specific to your business. Whether it s user roles, customer segments, or interaction types, custom dimensions allow you to delve into insights that mirror your unique goals and operations.
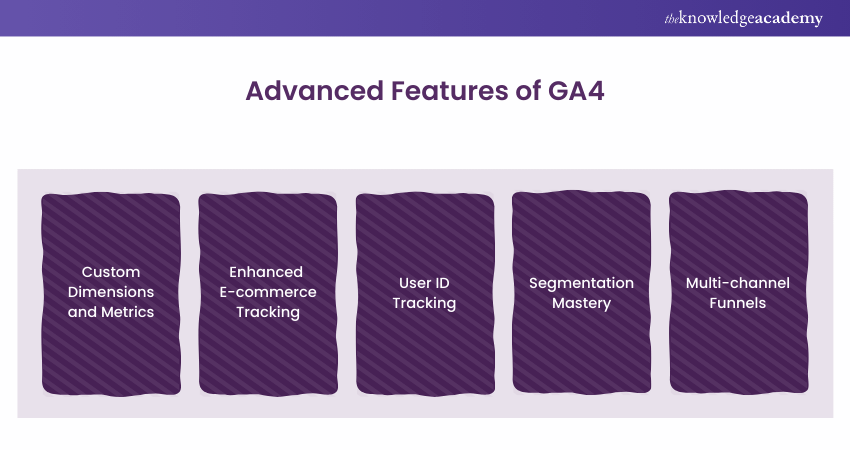
If you are running an online store, enhanced e-commerce tracking is a game-changer. It provides insights into shopping behaviour, product performance, and transaction details. By understanding the entire customer journey, from product views to purchases, you can optimise your online store for higher conversions.
When user's login or provide identifiers, user ID tracking lets you track their behaviour across sessions and devices. This helps create a more accurate picture of user interactions and engagement, especially for websites with member accounts or subscription models.
Segmentation is not just about dividing your audience; it is about creating powerful filters that uncover hidden trends. Utilise advanced segments to analyse subsets of data, such as high-value customers or users from specific geographical locations. This granularity reveals insights that might go unnoticed in broader data sets.
This feature lets you understand the entire conversion journey by tracking interactions across multiple channels and touchpoints. It reveals the interconnected web of interactions that lead to conversions, helping you allocate resources more effectively across various marketing channels.
Unlock powerful insights with our Google Analytics Certification – sign up now!
Conclusion
Congratulations, you have taken your first steps into the Google Analytics For Beginners domain! As you have discovered, this tool is not just about numbers – it is a compass guiding your digital strategies. From understanding audience dynamics to crafting impactful campaigns, you now possess the essential toolkit to harness insights that can shape your online success. Embrace the data, experiment with strategies, and explore the ever-evolving features.
Frequently Asked Questions

Google Analytics offers various reports, including Audience (demographics, interests), Acquisition (traffic sources), Behaviour (site content, user flow), and Conversion (goals, e-commerce). These reports provide insights into user behaviour, traffic sources, and overall website performance.

Google Analytics 4 allows you to target marketing campaigns by analysing user behaviour, segmenting audiences, and identifying high-conversion pathways. Utilise its predictive metrics and event-based tracking to create personalised, data-driven campaigns that resonate with your target audience.

The Knowledge Academy takes global learning to new heights, offering over 30,000 online courses across 490+ locations in 220 countries. This expansive reach ensures accessibility and convenience for learners worldwide.
Alongside our diverse Online Course Catalogue, encompassing 19 major categories, we go the extra mile by providing a plethora of free educational Online Resources like News updates, Blogs, videos, webinars, and interview questions. Tailoring learning experiences further, professionals can maximise value with customisable Course Bundles of TKA.

The Knowledge Academy’s Knowledge Pass, a prepaid voucher, adds another layer of flexibility, allowing course bookings over a 12-month period. Join us on a journey where education knows no bounds.

The Knowledge Academy offers various Digital Marketing Courses, including the Facebook Ads Course, the Digital Marketing Course and the Copywriting Course. These courses cater to different skill levels, providing comprehensive insights into Digital Marketing Campaign.
Our Digital Marketing Blogs cover a range of topics related to Google Analytics, offering valuable resources, best practices, and industry insights. Whether you are a beginner or looking to advance your Digital Marketing skills, The Knowledge Academy's diverse courses and informative blogs have got you covered.
Upcoming Digital Marketing Resources Batches & Dates
Date
 Digital Marketing Course
Fri 24th Jan 2025
Fri 28th Mar 2025
Fri 23rd May 2025
Fri 25th Jul 2025
Fri 26th Sep 2025
Fri 28th Nov 2025


 Top Rated Course


 If you wish to make any changes to your course, please


