We may not have the course you’re looking for. If you enquire or give us a call on 01344203999 and speak to our training experts, we may still be able to help with your training requirements.
Training Outcomes Within Your Budget!
We ensure quality, budget-alignment, and timely delivery by our expert instructors.

Imagine always knowing exactly how your IT services are performing. IT Service Management Metrics offer this clarity by delivering crucial insights into areas like cost, user satisfaction, and resolution times. These metrics highlight your IT team’s strengths and pinpoint where improvements are needed, ensuring seamless service delivery. In this blog, we’ll explore the nine key metrics that can transform your IT Service Management.
Table of Contents
1) IT Service Management Metrics
a) Cost per Ticket
b) First Contact Resolution Rate
c) User Satisfaction
d) Net Promoter Score (NPS)
e) Average First Response Time
f) Average Resolution Time (ART)
g) Resolution SLA Percent
h) Mean Time to Resolve (MTTR)
i) Change Success Rate
2) Conclusion
IT Service Management Metrics
Effective ITSM relies on various metrics to ensure that services are delivered and meet user expectations. Here, we discuss nine essential ITSM metrics that help organisations improve their IT services.
1) Cost per Ticket
It defines the average spendings to solve one ticket. This is important because it provides insight into the IT service desk finances. This further helps organisations determine areas which they can cut costs without have to negatively impact the quality of the services. If the cost per ticket is high, then this may mean that it is time to train the technicians better or get better tools.
For example, if the total cost of handling 100 tickets is £5000, the cost per ticket is £50.
2) First Contact Resolution Rate (FCR)
FCR is the percentage of tickets resolved in the first contact with the user. Higher FCR means that the IT service desk provides fast solutions to the incidents, hence improving users’ satisfaction. There are ways of enhancing FCR such as getting better service training to workers, creating more robust knowledge bases and more effective ticket routing systems.
For example, if 80 out of 100 tickets are resolved on the first contact, the FCR rate is 80%.
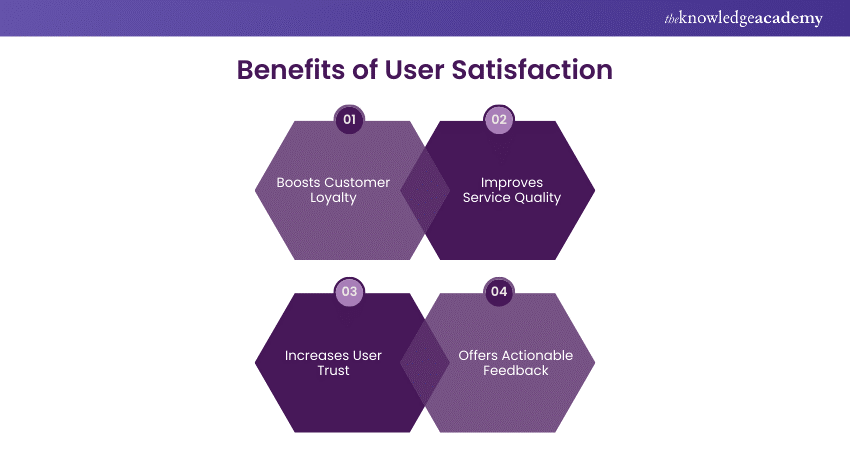
3) User Satisfaction
It is a metric that measures how satisfied users are with the IT services they receive. This can be measured through surveys and feedback forms. High user satisfaction is a sign that the IT service desk is meeting user needs effectively.

To improve this metric, organisations can focus on providing effective solutions, maintaining clear communication, and ensuring a user-friendly support experience.
For example, if 90 out of 100 users rate their experience as satisfactory, the user satisfaction rate is 90%.
4) Net Promoter Score (NPS)
It measures the likelihood of users recommending IT services to others. It is calculated based on user responses to the question, “How likely are you to recommend our IT services to a colleague?” A high NPS indicates strong user loyalty and satisfaction. To boost NPS, IT service desks should focus on resolving issues instantly.
For example, if 70 users are promoters, 20 are passives, and 10 are detractors, the NPS is 60.
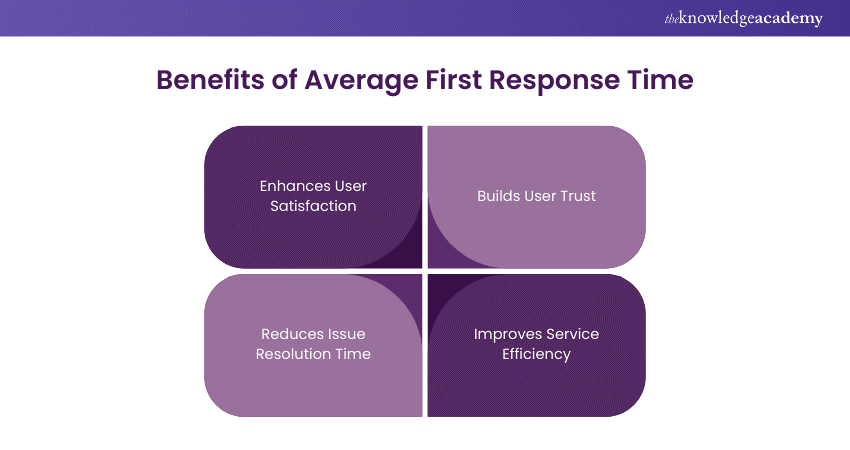
5) Average First Response Time
It measures the average time taken for the IT service desk to respond to a user’s initial request. This metric is important because users expect quick acknowledgment of their issues. Reducing the first response time can improve user satisfaction in the IT service desk.

Strategies to improve this metric include automating initial responses and ensuring adequate staffing during peak times.
For example, if the total response time for 100 tickets is 500 minutes, the average first response time is 5 minutes.
Boost the efficiency of your team with our Certified Agile IT Service Manager (CAITSM) - Join today!
6) Average Resolution Time (ART)
Average Resolution Time (ART) measures the average time taken to resolve a ticket from the moment it is logged. This helps in understanding the efficiency of the IT service desk in resolving issues. A lower ART indicates faster resolution of issues, leading to higher user satisfaction.
To reduce ART, organisations can streamline their processes, provide better training to technicians, and use more efficient tools.
For example, if the total resolution time for 100 tickets is 1000 minutes, the ART is 10 minutes.
7) Resolution SLA Percent
Resolution SLA Percent measures the percentage of tickets solved within the agreed Service Level Agreement (SLA) timeframes. Meeting SLA targets is crucial for maintaining user trust.
To improve this metric, IT service desks should monitor SLA compliance regularly, identify bottlenecks, and take corrective actions to ensure timely resolution of tickets.
For example, if 90 out of 100 tickets are resolved within the SLA, the resolution SLA percent is 90%.
8) Mean Time to Resolve (MTTR)
It refers to the average time that it takes to solve an incident once it has been logged. This metric is similar to the ART but confined to incidents only. A lower MTTR means that the IT service desk brings efficiency by solving incidents with a shorter response time.
To achieve better MTTR, enhancements can be made in the management processes, training of technicians, and employing technological aid.
For example, if the total time to resolve 50 incidents is 500 minutes, the MTTR is 10 minutes.
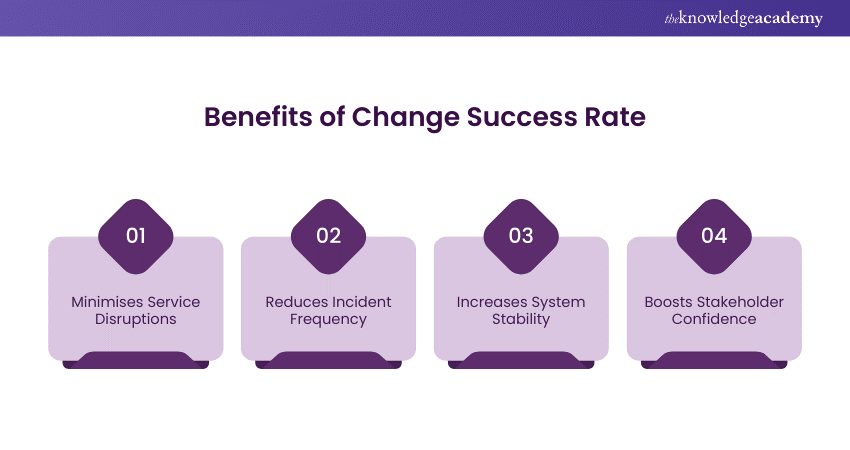
9) Change Success Rate
It measures the percentage of changes that are successfully implemented without causing incidents, problems, or service disruptions. This metric is important for assessing the effectiveness of the change management process.

A high change success rate indicates that changes are well-planned. To improve this metric, organisations should follow best practices in change management. They should conduct thorough testing before implementation and ensure clear communication with all stakeholders.
For example, if 95 out of 100 changes are successful, the change success rate is 95%.
Learn strategies with our Certified IT Service Manager Certification – Join today!
Conclusion
Monitoring IT Service Management Metrics is crucial for boosting IT services. It allows organisations to gauge their performance and pinpoint areas needing improvement. By analysing these metrics, teams can deliver efficient, effective, and user-friendly services. Keeping a close watch on these metrics ensures high standards and fosters continuous improvement in ITSM.
Learn best practices in IT Service Management with our ITIL® 4 Foundation Certification – Sign up today!
Frequently Asked Questions

A good metric is Service Level Agreement (SLA) compliance, which tracks if agreed service levels are being met. It helps assess how well the IT team delivers on promises made to customers.

Metrics help find information by showing issues for improvement. This allows IT teams to make decisions and prioritise resources effectively.

The Knowledge Academy takes global learning to new heights, offering over 30,000 online courses across 490+ locations in 220 countries. This expansive reach ensures accessibility and convenience for learners worldwide.
Alongside our diverse Online Course Catalogue, encompassing 19 major categories, we go the extra mile by providing a plethora of free educational Online Resources like News updates, Blogs, videos, webinars, and interview questions. Tailoring learning experiences further, professionals can maximise value with customisable Course Bundles of TKA.

The Knowledge Academy’s Knowledge Pass, a prepaid voucher, adds another layer of flexibility, allowing course bookings over a 12-month period. Join us on a journey where education knows no bounds.

The Knowledge Academy offers various Agile IT Service Management Training, including the Certified Agile IT Service Manager (CAITSM) Course and Certified IT Service Manager (CITSM) Certification. These courses cater to different skill levels, providing comprehensive insights into 10 Benefits of IT Service Management (ITSM).
Our IT Service Management Blogs cover a range of topics related to IT Service Management, offering valuable resources, best practices, and industry insights. Whether you are a beginner or looking to advance your IT Service Management knowledge, The Knowledge Academy's diverse courses and informative blogs have got you covered.
Upcoming IT Service Management Resources Batches & Dates
Date
 Certified Agile IT Service Manager (CAITSM)
Thu 19th Dec 2024
Thu 30th Jan 2025
Thu 1st May 2025
Thu 31st Jul 2025
Thu 27th Nov 2025


 Top Rated Course


 If you wish to make any changes to your course, please


