We may not have the course you’re looking for. If you enquire or give us a call on 01344203999 and speak to our training experts, we may still be able to help with your training requirements.
We ensure quality, budget-alignment, and timely delivery by our expert instructors.

With the increasing demands of modern work, teams are always looking for ways to work smarter, not harder. That’s where Kanban comes in—a simple yet powerful method to visualise tasks, streamline processes, and boost productivity. But how do you know if your Kanban system is actually working? The answer lies in Kanban Metrics.
These handy tools give you a clear picture of your team’s performance, showing where things are going smoothly and where improvements are needed. In this blog, we discuss the 10 core Kanban Metrics that can help your team deliver better results faster.
Table of Contents
1) What are Kanban Metrics?
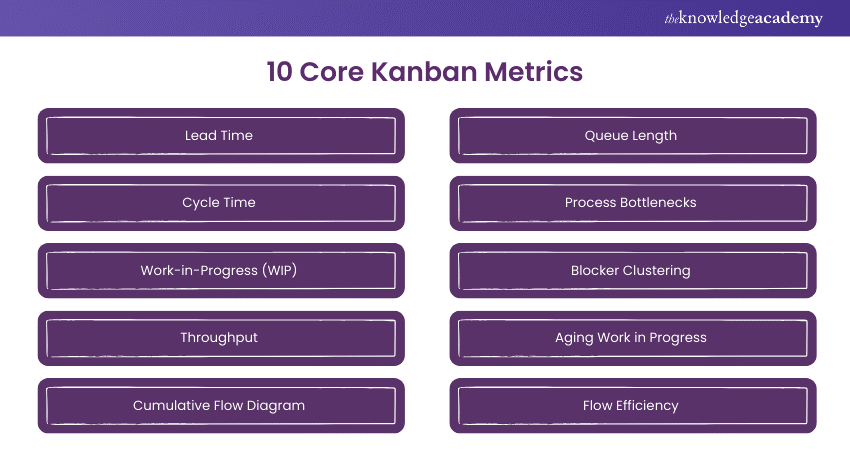
2) 10 Core Kanban Metrics
a) Lead Time
b) Cycle Time
c) Work-in-Progress (WIP)
d) Throughput
e) Cumulative Flow Diagram
f) Queue Length
g) Process Bottlenecks
h) Blocker Clustering
i) Aging Work in Progress
j) Flow Efficiency
3) Conclusion
What are Kanban Metrics?
Kanban Metrics are quantitative measures used to evaluate the performance of a Kanban system. These metrics provide insights into various aspects of the workflow, such as how long tasks take to complete, how many tasks are in progress, and where bottlenecks are occurring. By tracking these metrics, teams can make data-driven decisions to optimise their processes, reduce delays, and deliver value more efficiently.
The beauty of Kanban Metrics lies in their simplicity. They are easy to understand and can be applied to any team, regardless of the industry or type of work. Whether you're working in software development, manufacturing, or marketing, Kanban Metrics can help you improve your workflow.
10 Core Kanban Metrics
Now, let's look at the 10 core Kanban Metrics that every team should measure.

1) Lead Time
Lead time refers to the total time it takes for a task to move from the start to the finish. In other words, it’s the time from when a task is requested until it is delivered. Lead time is an important metric because it gives you an overall view of how quickly your team is able to deliver value to the customer.
Shorter lead times generally indicate a more efficient process, while longer lead times may suggest bottlenecks or delays. By tracking lead time, teams can identify areas where they can speed up delivery and reduce waiting times.
2) Cycle Time
Cycle time is a subset of lead time. It measures the time it takes for a task to move from the "In Progress" stage to the "Done" stage. Unlike lead time, which includes waiting periods, cycle time focuses only on the active working time.
This metric helps teams understand how long it takes to complete tasks once work has started. Reducing cycle time is often a key goal in improving team efficiency. When comparing Cycle Time vs Lead Time, it's important to note that while cycle time measures the active time spent on a task, lead time captures the full time, including any waiting periods before or between stages.
3) Work-in-Progress (WIP)
Work-in-Progress refers to the number of tasks that are currently being worked on at any given time. Kanban encourages teams to limit WIP to prevent overloading team members and ensure a steady flow of work.
By monitoring WIP, teams can balance their workload, avoid multitasking, and reduce stress. A high WIP may indicate that too many tasks are in progress, leading to potential delays and decreased quality.
Master the basic skills in Kanban with our Certified Kanban Foundation Training – Join today!
4) Throughput
Throughput measures the number of tasks completed within a specific time frame, such as a week or month. It gives teams an understanding of how much work they are delivering over time.
By tracking throughput, teams can set realistic expectations, predict future performance, and identify trends. Increasing throughput is often a sign of an efficient and productive team.
5) Cumulative Flow Diagram
A Cumulative Flow Diagram (CFD) is a visual representation of the different stages of work in a Kanban system over time. It shows the amount of work in each stage, helping teams identify bottlenecks and understand flow patterns.
The CFD helps teams see where tasks are piling up, where work is flowing smoothly, and where improvements can be made. It's a powerful tool for visualising progress and ensuring a balanced workflow.
6) Queue Length
Queue length refers to the number of tasks waiting to be worked on in the backlog or a particular stage of the process. Long queues can indicate bottlenecks, where tasks are stuck waiting for resources or attention.
Monitoring queue length helps teams identify where tasks are piling up and take action to address the issue. Reducing queue length often leads to faster delivery and improved efficiency.
7) Process Bottlenecks
A bottleneck is any point in the process where work slows down or gets stuck. Bottlenecks can occur due to various reasons, such as resource limitations, dependencies, or inefficient processes.
Identifying and addressing bottlenecks is crucial for maintaining a smooth flow of work. By tracking where and when bottlenecks occur, teams can implement changes to eliminate them and improve overall performance.
8) Blocker Clustering
Blocker clustering refers to the analysis of tasks that have been blocked or delayed during the workflow. This metric helps teams identify common causes of delays and take corrective actions.
By clustering blockers, teams can see patterns and trends, such as recurring issues or specific stages where tasks are frequently blocked. Addressing these blockers can significantly improve the flow of work and reduce delays.
9) Aging Work in Progress
Aging work in progress refers to tasks that have been in progress for a long time without being completed. This metric helps teams identify tasks that may be at risk of becoming stale or forgotten.
By monitoring aging WIP, teams can take proactive steps to either complete the tasks or reassess their priority. Reducing aging WIP helps keep the workflow fresh and prevents tasks from lingering too long in the system.
10) Flow Efficiency
Flow efficiency measures the ratio of active working time to the total lead time for a task. It shows how much of the lead time is spent on actual work versus waiting or being idle.
High flow efficiency indicates that a significant portion of the lead time is spent on productive work, while low flow efficiency suggests that there is a lot of waiting or idle time. Improving flow efficiency is a key goal for many teams, as it leads to faster delivery and better utilisation of resources. To enhance flow efficiency, teams can refer to a Kanban Cheat Sheet, which provides valuable tips and techniques for optimising workflow and minimising delays in the process.
Transform your workflow with Certified Kanban Practitioner Training – Join today!
Conclusion
Kanban Metrics are vital for measuring and enhancing team performance. By tracking these metrics, teams can gain insights into their workflow, identify improvement areas, and make data-driven decisions. From lead time to flow efficiency, each metric offers a unique perspective on performance, helping teams deliver value effectively. Regularly monitoring these metrics ensures continuous improvement, timely issue resolution, and optimised workflows.
Learn Kanban principles with our Certified Kanban Foundation and Practitioner Training – Sign up now!
Frequently Asked Questions
What are Some of the Challenges of Using Kanban Metrics?

One challenge is that metrics can be misinterpreted or lead to focusing too much on numbers instead of actual workflow improvements. Additionally, inconsistent tracking can result in unreliable data, making it difficult to identify real issues.
How do you Implement Kanban Metrics in a Team or Organisation?

Start by introducing key metrics like lead time and cycle time and ensure everyone understands their purpose. Regularly review the metrics in team meetings to identify trends, discuss improvements, and adjust the process as needed.
What are the Other Resources and Offers Provided by The Knowledge Academy?

The Knowledge Academy takes global learning to new heights, offering over 3,000 online courses across 490+ locations in 190+ countries. This expansive reach ensures accessibility and convenience for learners worldwide.
Alongside our diverse Online Course Catalogue, encompassing 19 major categories, we go the extra mile by providing a plethora of free educational Online Resources like News updates, Blogs, videos, webinars, and interview questions. Tailoring learning experiences further, professionals can maximise value with customisable Course Bundles of TKA.
What is The Knowledge Pass, and How Does it Work?

The Knowledge Academy’s Knowledge Pass, a prepaid voucher, adds another layer of flexibility, allowing course bookings over a 12-month period. Join us on a journey where education knows no bounds.
What are Related Courses and Blogs Provided by The Knowledge Academy?

The Knowledge Academy offers various Kanban Training, including the Certified Kanban Foundation and Practitioner Training, Certified Kanban Foundation Training and Certified Kanban Practitioner Training. These courses cater to different skill levels, providing comprehensive insights into Kanban Roles.
Our Business Improvement Blogs cover a range of topics related to Kanban, offering valuable resources, best practices, and industry insights. Whether you are a beginner or looking to advance your Kanban knowledge, The Knowledge Academy's diverse courses and informative blogs have got you covered.
Upcoming Business Improvement Resources Batches & Dates
Date
 Certified Kanban Foundation and Practitioner Training
Mon 4th Aug 2025
Mon 3rd Nov 2025


 Top Rated Course


 If you wish to make any changes to your course, please


