


 Top Rated Course

We may not have the course you’re looking for. If you enquire or give us a call on 01344203999 and speak to our training experts, we may still be able to help with your training requirements.
Power BI Architecture: A Detailed Explanation
Sienna Roberts 26 April 2023Learn about Power BI Architecture to understand core components, services, their functions and how they work together in business analytics. This blog gives you a brief introduction to Power BI Architecture, its key components, working process, and Power BI services.

Training Outcomes Within Your Budget!
We ensure quality, budget-alignment, and timely delivery by our expert instructors.
Table of Contents
Related Courses
- Quick Powerful Graphics with Power View, PowerPivot, Power Query, Power Map and Power BI M55164
- Microsoft Power BI for End Users 55400AC
- Retired : Designing and Implementing Enterprise-Scale Analytics Solutions Using Microsoft Azure and Microsoft Power BI DP500
- Microsoft Power BI Data Analyst PL300
- Microsoft BI Training

Power BI, as we know, is a business and data analytics service that facilitates the processing, analysis, and visualisation of large amounts of data. The Microsoft service helps in the extraction of insights, drawing conclusions, and sharing of results in the form of visual reports or dashboards across various departments. While knowledge of Power BI is important, it is equally important to understand how Power BI Architecture works.
According to Microsoft, over 5 millions of subscribers have adopted the tool for modern business intelligence. Power BI is changing the way that organisations handle data, helping them turn data into opportunity. This blog explores everything you need to know about Power BI Architecture and provides insights into its components and working process.
Table of Contents
1) Introduction to Power BI Architecture
2) What are the Components of Power BI Architecture?
3) How Does Power BI Architecture Work?
4) What is Power BI Service and how Does its Architecture Work?
5) Conclusion
Introduction to Power BI Architecture
The structure of Power BI acts as the foundation for a potent Business Intelligence tool, allowing companies to efficiently analyse and visualise data. In essence, Power BI is created to transform unprocessed data into useful insights using an organised system. Important elements of this structure comprise:
a) Data Sources: Power BI can access various data sources like databases, spreadsheets, and cloud services to help users collect data from different platforms.
b) Data Transformation: By using Power Query, individuals are able to clean and modify data, making sure it is suitable for analysis. This procedure improves the quality and accuracy of data.
c) Data Model: The data model acts as the base for generating reports, enabling users to establish connections among various data tables and generate calculated metrics for more thorough analysis.
d) Visualisation Layer: Power BI offers a wide variety of visualisation tools that allow users to design engaging dashboards and reports, showcasing data in an aesthetically pleasing way.
e) Cloud and On-premises Options: Power BI is flexible, as it can be installed on the cloud (Power BI Service) or on-premises (Power BI Report Server) to cater to organisations' specific requirements.
Businesses can harness Power BI's complete capabilities for data-driven decision-making by understanding this architecture.

What are the Components of Power BI Architecture?
Before we delve deeper into how the Power BI Architecture works, we need to have a brief idea of the components of make up the architecture. In this section of the blog, we will learn about the different components that combine to form the Power BI Architecture.
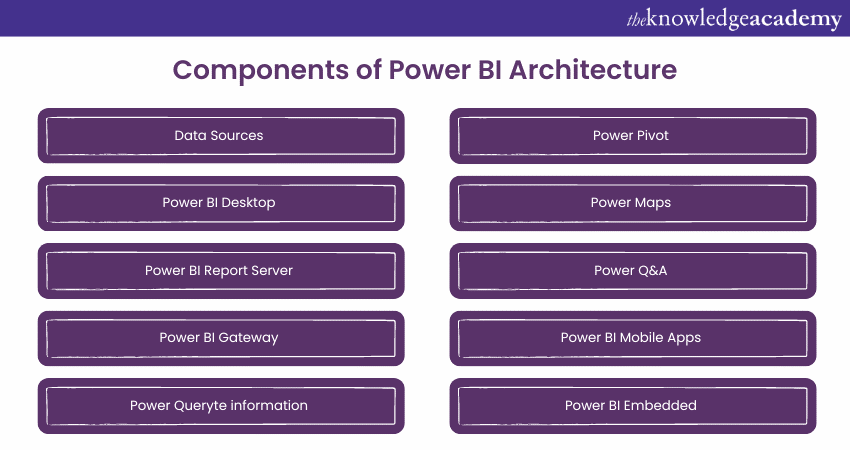
1) Data Sources
One of the most important components of Power BI’s Architecture is its vast range of data sources. With Power BI, you can import data from files in your system, cloud-based online sources, or establish direct connections. It's important to note that the limit for data imported on-premises or from online services is 1 GB. The limit can be increased to 10 GB with premium subscription of Power BI. Some of the commonly used data sources in Power BI include:
1) Excel
2) XML
3) JSON
4) Text/CSV
5) MySQL Database
6) Oracle Database
7) PostgreSQL Database
8) IBM DB2 Database
9) Sybase Database
10) SAP HANA Database
11) Teradata Database
12) SAP Business Warehouse server
13) Impala
14) Azure SQL Database
15) Google BigQuery (Beta)
16) Google Analytics
17) Salesforce Reports
18) Github
19) Amazon Redshift
20) Facebook
2) Power BI Desktop
Power BI Desktop is an important component of the architecture. It is essentially a client-side tool that is best used as a companion tool for development and authoring. It is a desktop-based software equipped with tools and functionalities to help connect to data sources, transform data, model data, and create reports. One can download and install the component on their system for free. Using the Power BI Desktop feature, one can cleanse data, create business metrics and data models, define hierarchies, and create visuals and reports.
3) Power BI Service
Power BI Service is a web-based platform that can be used to share reports created on Power BI Desktop, collaborate with other users, and create dashboards. This web-based feature is available in three versions, namely the free version, the pro version, and the premium version. Power BI Service is also known by several other names such as “Power BI Site”, “Power BI.com”, “Power BI Workspace”, and “Power BI Web Portal”. Another feature of Power BI Service is that it offers advanced features, such as Natural Language Q&A and alerts.
4) Power BI Report Server
The Power BI Report Server is very similar to the Power BI Service. While there are ample similarities between the two components, there is one significant feature that helps differentiate between the two. Power BI Service is a cloud-based platform, while Power BI Report Server is an on-premises platform. Power BI Report Server is generally used by organisations that are not willing to publish their reports on the cloud and have concerns about the security of their data. Power BI Report Server facilitates the creation of dashboards and sharing of reports with other users while maintaining proper security protocols. However, it must be kept in mind that in order to use this service, one needs to have a Power BI Premium license.
5) Power BI Gateway
Power BI Gateway is generally used to connect and access on-premises data in secured networks. Organisations that keep data in security generally use the feature of Power BI Gateway. The Gateway allows data extraction to Power BI platforms through secure channels for analysis and reporting purposes.
6) Power Query
Power Query is a feature that helps users discover, connect with, and combine data according to their specific and customised needs. Power Query can be downloaded as an additional tool in Microsoft Excel or used directly as a part of the Power BI Desktop tool.
7) Power Pivot
Power Pivot in Power BI is a data modelling technique that facilitates the creation of data models, establishing relationships, and creating calculations. The Power BI feature uses the Data Analysis Expression (DAX) language to model both simple and complex data.
8) Power View
Power View is a feature of Power BI that can be used with Excel, SharePoint and SQL Server. It allows users to create interactive visuals such as charts, graphs, and maps that bring data to life. Power View can also connect to different data sources and apply suitable filters to the data for specific elements or the entire report.
9) Power Maps
Another useful component of Power BI is Power Maps for Excel and Power BI. It is a 3D Data Visualisation tool that allows users to map their data and plot millions of rows on Bing Maps in 3D format directly from Excel. The Power Maps feature works in tandem with Bing Maps to find the most suitable visualisation based on parameters such as latitude, longitude, country, state, city, and street address data.
10) Power Q&A
The Q&A feature embedded in Power BI helps users explore data according to their specific needs. It is known as the most convenient way to answer questions using natural language. Once a user has built their data model and deployed it into the Power BI website, they can ask questions and get quick answers.
11) Power BI Mobile Apps
Power BI Mobile Apps are another set of native applications that runs on iOS, Android, and Windows mobile devices. These applications are commonly used for viewing reports and dashboards on-the-go and at short notice.
12) Power BI Embedded
Power BI Embedded is known for offering APIs that facilitate the embedding of visuals into custom applications.
To know more about identifying and connecting to data sources in Power BI, join our Microsoft Power BI Data Analyst PL300 now!
How Does Power BI Architecture Work?
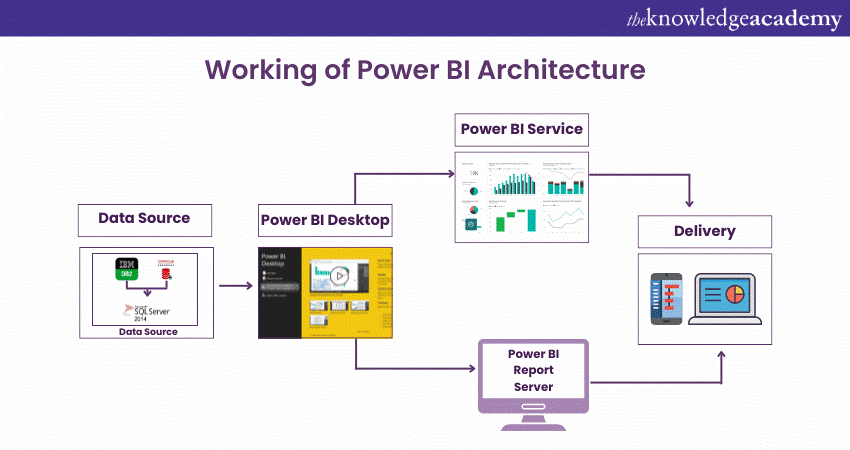
Now that we have a brief idea of the individual components of Power BI, let’s delve deeper into how all these components work together. To begin with, data sources are the starting point of the working process in Power BI. Power BI has a feature that allows users to connect to a variety of data sources, such as files, on-premises or cloud databases, and direct connections. These data sources are then used to create data connections to authoring tools like Power BI Desktop.
Data sources that can be connected to Power BI are divided into two broad categories – on-premises and on-cloud sources.
On-premises
Power BI Desktop is used as a companion development, authoring, and publishing tool. Users can import data from data sources to Power BI Desktop and use the data for the creation and publishing of reports on a Power BI Service or Power BI Report Server. Users can also publish Excel workbooks directly using a tool called Power BI Publisher for Excel.
SQL Server Data Tools and Report Publisher facilitate the creation of datasets, KPIs, mobile reports, and paginated reports, among others. All kinds of reports, irrespective of their type, are published to the Power BI Report Server and then distributed to the end users.
On-cloud
An important component in the Power BI Architecture, as mentioned earlier, is the Power BI Gateway. It acts as a secure channel to transport data from on-premises sources to on-cloud applications. The cloud side of the architecture houses several components, such as dataflows, datasets, dashboards, reports, Power BI Embedded, Power BI Premium, and more. Users can embed their reports and dashboards into Teams, SharePoint, custom applications, and other platforms. On-cloud data sources can connect to Power BI tools via direct connections. Users who share the published reports and dashboards for collaboration and insight-based decision making can connect with each other through web browsers, Excel, and mobile devices (iOS, Windows, Android apps).
The Working Process of the Power BI Architecture
The working process of the Power BI Architecture is made up of four major steps that explain the process from data sourcing to the creation of reports and dashboards. The software implements a variety of technologies and processes in tandem to achieve the required results with precision. This section of the blog will elaborate on the steps of the working process.
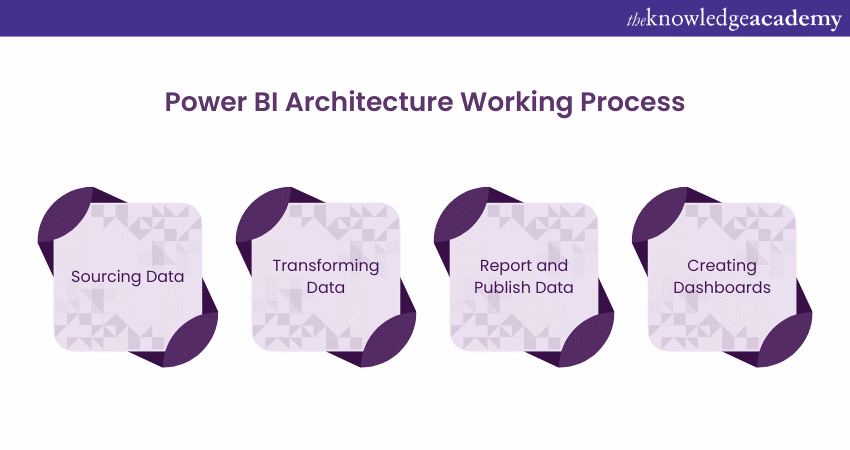
Sourcing Data
The first step in the working process of Power BI Architecture is sourcing data. Power BI can extract data from various sources such as Microsoft Excel sheets, CSV files, and databases. The extracted data can be directly imported into Power BI, or a live service link can be established to receive the data. It’s important to note that if data is directly imported into Power BI, it can only be compressed to a maximum size of 1 GB. Only live queries can be run once past that limit.
Transforming Data
Before using Power BI to visualise the data in a usable context, cleaning and pre-processing should be performed. Cleaning and pre-processing involve removing useless or missing values from rows and columns in the datasheet. After completing these processes, certain rules and policies will be applied to transform the data and load the datasets into the warehouses.
Report and Publish Data
Once the data is cleaned, processed, and transformed, visual reports will be created according to the specific needs of the organisation. A report is a visualisation of the data with different filters applied, presented in the form of graphs, pie charts, and other graphic representations. Converting raw data into contextualised information is one of the most important steps in the Power BI Architecture working process.
Creating Dashboards
The final step in the working process of Power BI Architecture is the creation of dashboards. Power BI dashboards are created by pinning elements or pages of live reports. It’s important to note that dashboards should be created only after reports have been published to the BI service. Upon saving the report, the chosen filter settings are maintained so that the user can apply filters as per their specific demands.
What is Power BI Service and how Does its Architecture Work?
As mentioned earlier, Power BI Service is a cloud platform where all the reports created on Power BI Desktop are published. These reports and dashboards can be accessed from Power BI Service using client platforms such as websites, mobile devices, etc. This means that to access content created on Power BI, users need to interact with Power BI Service.
Before delving deeper into how it works, it’s important to understand the components of its architecture. Power BI Service’s Architecture consists of two components, namely – the front end and the backend cluster.
1) Frontend Cluster
The frontend cluster of the Power BI Service Architecture, also known as the front-end cluster, acts as an intermediate connection between clients and the backend of the architecture. Front-end services are used to establish connections and authenticate clients using Azure Active Directory – a directory that stores user identities.
Backend Cluster
The backend cluster of the Power BI Service Architecture handle visualisations, datasets, storage, reports, and other interactions with Power BI. A web client only has two direct points of interaction at the backend of the architecture, namely Azure API Management and Gateway Role. These two components, together, work to achieve load balancing, authentication, authorisation, and routing.
Power BI stores its data in two main storage types, namely – the Azure block storage and the Azure SQL database. The former stores datasets uploaded by users, while the latter stores all the metadata and system-related data. User requests are sent to the Gateway Role after Azure API Management authenticates them. The Gateway Role oversees the processing of the requests and directing them to components such as the Presentation Role, Background Job Processing Role, Data Role, and more.
User requests are redirected to suitable components based on the type of query – for instance, visualisation-related queries are sent to the Presentation Role, while data-related queries are sent to the Data Role. To connect and fetch the data from on-premises data sources to the cloud, an Azure Service Bus is used. The Azure Service Bus receives requests to fetch data, processes it, and executes the query on the on-premises data source to redirect its data to the cloud. Meanwhile, Azure Service Fabric manages the microservices associated with Power BI, and Azure AD Cache helps create reports from data stored in its in-memory.
Conclusion
All in all, Power BI is one of the most useful tools used in modern-day organisations to help visualise data and streamline time and effort. The Microsoft service uses its components to facilitate contextualisation and visualisation and helps organisations increase their efficiency in data usage. Power BI also provides organisations with a level of personalisation and integration with other tools, such as Excel, into their workflow. All the components present in the Power BI Architecture work in tandem to assist organisations, making it important to understand how its architecture works to optimise the tool.
Become an expert in Power BI by signing up for our Microsoft Power BI Course – Sign up today!
Frequently Asked Questions
What is Architecture in BI?

In Business Intelligence (BI), architecture is a structure that outlines the collection, storage, processing, and visualisation of data. It includes different elements such as data sources, data warehouses, and reporting tools, allowing organisations to convert raw data into useful insights for decision-making.
What are Some Best Practices for Designing Power BI Architecture?
Some of the best practices of Power BI Architecture include optimising data sources, using a well-organised data model, and applying row-level security. In addition to this, it maintains a consistent naming convention to enhance collaboration and usability.
What are the Other Resources and Offers Provided by The Knowledge Academy?
The Knowledge Academy takes global learning to new heights, offering over 30,000 online courses across 490+ locations in 220 countries. This expansive reach ensures accessibility and convenience for learners worldwide.
Alongside our diverse Online Course Catalogue, encompassing 19 major categories, we go the extra mile by providing a plethora of free educational Online Resources like News updates, Blogs, videos, webinars, and interview questions. Tailoring learning experiences further, professionals can maximise value with customisable Course Bundles of TKA.
What is The Knowledge Pass, and How Does it Work?
The Knowledge Academy’s Knowledge Pass, a prepaid voucher, adds another layer of flexibility, allowing course bookings over a 12-month period. Join us on a journey where education knows no bounds.
What are the Related Courses and Blogs Provided by The Knowledge Academy?
The Knowledge Academy offers various Business Intelligence Reporting Courses, including Business Intelligence Analyst Course, Microsoft Power BI Course, and Microsoft BI Training. These courses cater to different skill levels, providing comprehensive insights into Business Intelligence (BI).
Our Office Applications Blogs cover a range of topics related to Power BI, offering valuable resources, best practices, and industry insights. Whether you are a beginner or looking to advance your Business Intelligence skills, The Knowledge Academy's diverse courses and informative blogs have got you covered.
Upcoming Microsoft Technical Resources Batches & Dates
Date
 Microsoft Power BI Course
Microsoft Power BI Course
Wed 15th Jan 2025
Microsoft Power BI Course
Wed 5th Feb 2025
Microsoft Power BI Course
Wed 9th Apr 2025
Microsoft Power BI Course
Wed 11th Jun 2025
Microsoft Power BI Course
Wed 6th Aug 2025
Microsoft Power BI Course
Wed 8th Oct 2025
Microsoft Power BI Course
Wed 3rd Dec 2025
 If you wish to make any changes to your course, please


