


 Top Rated Course

We may not have the course you’re looking for. If you enquire or give us a call on 01344203999 and speak to our training experts, we may still be able to help with your training requirements.
What is Probability? The Ultimate Guide
Eliza Taylor 24 March 2025Probability is a Mathematics and Data Science branch that quantifies uncertainty by assigning values between 0 and 1 to events. A Probability of 0 means an event is impossible, while a probability of 1 means it is certain. It covers fundamental concepts, formulas, and theorems to analyse outcomes in daily decisions, research, and industries.
Training Outcomes Within Your Budget!
We ensure quality, budget-alignment, and timely delivery by our expert instructors.
Table of Contents
What is Probability in MathematicsEvents in Probability Probability Formulas Different Types of Probability Probability Distribution Types of Probability Distribution Probability Theorems Examples of Probability Applications of Probability How to Figure out the Odds of Something? How to Calculate the Probability of Something not Happening?Conclusion

Have you ever imagined how businesses predict market trends with 95% accuracy? In today’s fast-paced world, such precision feels almost magical. The secret lies in Probability—the mathematical backbone of decision-making that guides every strategic move.
From analysing financial models to planning daily tasks, mastering Probability transforms ambiguity into clarity. Embrace this journey to discover how one simple concept can revolutionise your approach to risk and reward!
Table of Contents
1) What is Probability in Mathematics?
2) Events in Probability
3) Probability Formulas
4) Different Types of Probability
5) Probability Distribution
6) Types of Probability Distribution
7) Probability Theorems
8) Examples of Probability
9) Applications of Probability
10) How to Figure out the Odds of Something?
11) How to Calculate the Probability of Something Not Happening?
12) Conclusion
What is Probability in Mathematics
Probability is defined as the measure of how likely an event is to happen, usually expressed as a value between zero and one. A Probability of zero indicates that the event is impossible, while a Probability of one signifies absolute certainty. This concept helps quantify uncertainty in a mathematical framework, allowing for predictions and informed decision-making.
A common real-life example of Probability is weather forecasting. For instance, when a forecast states there is a 70% chance of rain, it means that under similar conditions in the past, rain occurred 70% of the time.
Key Terms in Probability
Here are some foundational concepts or terminologies used in Probability:
a) Sample Space: This is the set of all possible outcomes in a Probability experiment. For instance, in the case of a coin toss, it’s “heads” and “tails.”
b) Sample Point: This defines one of the possible results of an experiment. For example, sample points are 1 to 6 when rolling a fair six-sided dice.
c) Experiment: This refers to a process with uncertain results. Examples include card selection, coin tossing, or rolling a die.
d) Event: This defines a subset of the sample space that represents specific outcomes, such as getting “3” when rolling a die.
e) Favourable Outcome: This outcome produces the desired or expected consequence.

Events in Probability
According to Probability Theory, an event is a set of outcomes of an experiment. Let's say P(E) represents the Probability of event E, then we get:
a) P(E) = 0 if and only if E is an impossible event
b) P(E) = 1 if and only if E is a possible or certain event
c) 0 ≤ P(E) ≤ 1
Let's say we have two events, A and B. The event A Probability, P(A) > P(B) if and only if event A is likelier to occur than event B. Sample space(S) is the set of all experiment's possible outcomes, and n(S) is the number of sample space outcomes.

E’ indicates that the event won’t occur.
Therefore, we can also conclude that, P(E) + P(E’) = 1
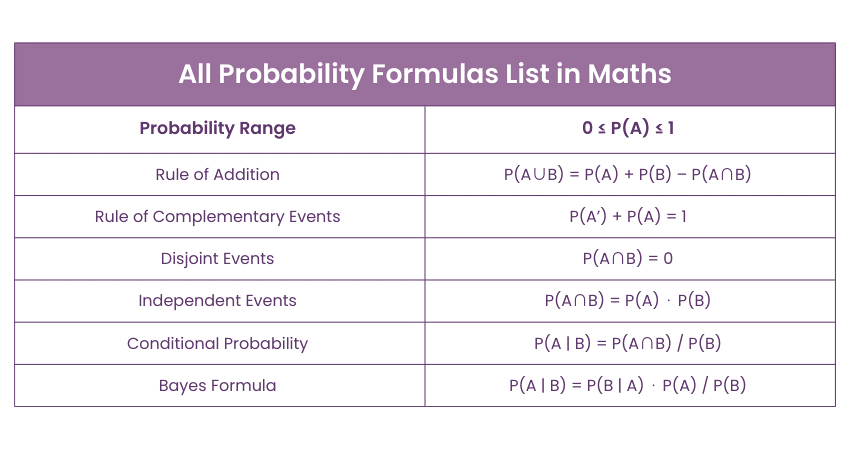
Probability Formulas
The Probability formulas for the events A and B are summarised below:
Different Types of Probability
There are seven major types of probabilities, namely Theoretical Probability, Experimental Probability and Axiomatic Probability. These are explored in detail below:

1) Theoretical Probability
Theoretical Probability is where the likelihood of something occurring is certain without the assistance of an experiment. The Probability of an event is reached through prior experiments. It's represented in Maths in this way:


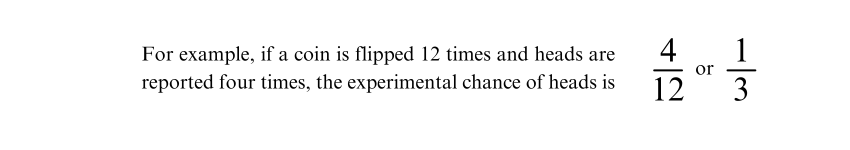
2) Experimental Probability
Experimental Probability (also referred to as Empirical Probability) is the ratio of trials carried out and the number of times a particular event occurs. Experimental Probability matches the general Probability definition but within the context of the research study or experiment.
To analyse this, researchers usually experiment multiple times to obtain trustworthy results. Mathematically, Experimental Probability is expressed as follows:

3) Conditional Probability
Conditional Probability measures the likelihood of a happening event given that another event has already happened. It refines our predictions by incorporating new information into the Probability assessment.
Mathematically, it is defined as

This concept is vital in fields like statistics, risk analysis, and decision-making, where outcomes are influenced by prior events.
4) Axiomatic Probability
In the Axiomatic Probability case, a set of rules or axioms is applied to every type. The occurrence (or non-occurrence) chance of an event is quantified by applying these axioms as explained below:
b) A certain event has a Probability equal to one.
c) Any two mutually exclusive events can't coincide, while the union of events says only one can occur.
5) Subjective Probability
Subjective Probability is an approach for likelihood assessment that relies on personal judgment, intuition, and experience rather than on objective statistical data. It is especially useful in case of limited historical data or when there are too complex outcomes for conventional Probability models.
This method allows individuals to make decisions under uncertainty by drawing on their own insights, although it can be influenced by personal biases. Despite these limitations, Subjective Probability is often employed in Economics, Psychology, and risk management, among other key fields where expert opinions play a crucial role.
Boost your data analysing skills with our Probability And Statistics For Data Science Training, Sign up now!
6) Joint Probability
Joint Probability is defined as the likelihood of two coinciding events. It is expressed as P(A and B) or P(A ∩ B) and, when the events are independent, can be calculated by multiplying the Probability of one event by the Probability of the other.
In cases where the events are dependent, the calculation incorporates the Conditional Probability. This concept is fundamental in fields, including Statistics, risk management, and Data Science, where understanding the interaction between events is crucial for making informed decisions.
7) Marginal Probability
Marginal Probability refers to an event's likelihood of occurring without consideration of any other variables. It is derived by joint Probabilities summing and integration of all possible outcomes of the other variables in the dataset. This provides an overall measure of an event's Probability.
Marginal Probability is essential in fields like Statistics, risk management, and data analysis. It serves as a key building block in Probability Theory and is widely used in Statistics and data analysis.
Probability Distribution
A Probability distribution is an elementary concept in Statistics that describes how Probabilities are assigned to different outcomes of a random variable.
It provides a complete picture of each possible outcome’s likelihood, whether the variable is discrete or continuous. Moreover, it serves as a vital component of statistical analysis, enabling us to model and predict the likelihood of various events.
Types of Probability Distribution
The various types of Probability Distribution are explained below:
a) Discrete Distribution: Assigns Probabilities to countable outcomes, like the number of successes in trials.
b) Continuous Distribution: Represents Probabilities over a continuum using density functions.
c) Uniform Distribution: Offers equal Probability for all outcomes within a specific range.
d) Normal Distribution: Features a bell-shaped curve where outcomes near the mean are most frequent.
e) Exponential Distribution: Models the time between events, often used in waiting time analysis.
f) Binomial Distribution: Captures the number of successes in a fixed number of independent trials.
Want to unlock the power of data to gain deeper insight into your industry? Sign up for our detailed Statistics Course now!
Probability Theorems
The following Probability Theorems find widespread application in Mathematics:
1) Addition Theorem: If A and B are two events, the Probability of their union is:

2) Multiplication Theorem: This describes the Probability of the two events A and B intersection:

3) Law of Total Probability: If {B1,B2,…,Bn} is a partition of the sample space, the Probability of an event A is:

4) Bayes' Theorem: This describes the Probability of an event’s occurrence related to any condition. The formula for Baye’s Theorem is:

5) Complement Rule: The Probability of the complement of an event A is:

6) Independence Rule: Two events A and B are independent if:

7) Conditional Probability Formula: The Probability of event A under the condition that B has occurred is:

8) Bernoulli’s Theorem (Law of Large Numbers): As the number of independent trials increases, the relative frequency of an event converges to its true Probability. This theorem is expressed as follows:

Master the art of informed decision-making with our comprehensive Decision Tree Modelling Using R Course – Sign up now!
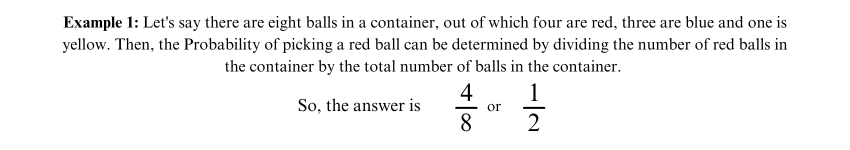
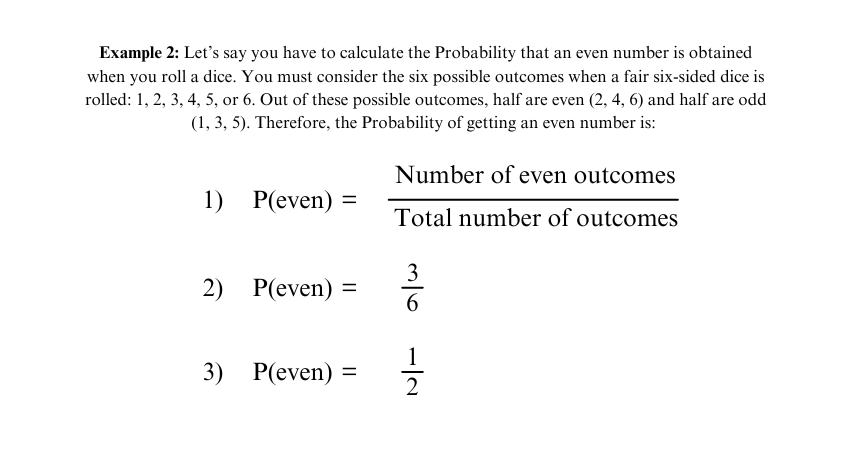
Examples of Probability
Here are a couple of examples to illustrate the concept of Probability
Applications of Probability
Probability boasts a broad variety of applications in real life. Some basic applications include the following events:
1) Card Selection: When drawing a card from a deck, Probability quantifies the selection chances of a particular card, enhancing strategic play in various games.
2) Coin Tossing: In a coin toss, Probability assigns equal likelihood to heads or tails, illustrating the basic randomness and fairness principles.
3) Dice Rolling: When throwing a dice, Probability determines the chance of each face appearing, serving as a classic example of understanding random events.
4) Lucky Draw: Probability is used for winning chances estimation in a lucky draw, providing the mechanics insights behind seemingly unpredictable outcomes.
5) Risk Modelling: In diverse industries, Probability is essential for risk assessment and modelling, helping with overall potential hazard forecasts and devising effective mitigation strategies.
6) Weather Forecasting: Meteorologists apply Probability for weather change prediction, ensuring that forecasts are rooted in statistical data and trend analysis.
7) Sports Prediction: In sports analytics, Probability calculates a team's winning chances through players' performance and team dynamics evaluation, thereby informing tactical decisions.
8) Market Analysis: In the share market, Probability is crucial in determining the price hikes and market shifts likelihood, guiding investors in making informed decisions.
How to Figure out the Odds of Something?
To figure out the odds of an event, start by calculating its Probability. Then, convert that Probability into odds by dividing it by one minus the Probability.
For example, If an event has a Probability of 20% (0.20):
Subtract 0.20 from 1 → 1 - 0.20 = 0.80
Divide 0.20 by 0.80 → 0.20 ÷ 0.80 = 0.25
This gives odds of 0.25, which can be expressed as "1 to 4" (or equivalently, "1:4"). This means the event is four times more likely not to happen than to happen.
How to Calculate the Probability of Something not Happening?
You can use the following formula to calculate the Probability of something not happening:
P(A') = 1−P(A)
Here, P(A) = Probability of the event occurring.
P(A') = Probability of the event not occurring.
Lead the data evolution with our Python Data Science Course- Join now!
Conclusion
Understanding What is Probability goes more than just numbers; it's about embracing the unpredictable facets of life. Moreover, it serves as a powerful way to understand the uncertainties we experience in our daily lives. Whether you are rolling a dice or calculating your business risks, this Probability blog becomes a necessary part of your daily Data Science arsenal.
Want to learn predictive modelling techniques for better data-driven insights? Sign up for our Predictive Analytics Course now!
Frequently Asked Questions
What is the Difference Between Probability and Statistics?
Probability deals with the possibility of events and uses known data to predict future events. In contrast, Statistics involves the collection, analysis, interpretation, organisation and presentation of data.
What is a Random Variable in Probability?
A random variable in Probability is a real-valued function defined over a random experiment's sample space. Its values correspond to the outcomes of the experiment.
What are the Other Resources and Offers Provided by The Knowledge Academy?
The Knowledge Academy takes global learning to new heights, offering over 3,000 online courses across 490+ locations in 190+ countries. This expansive reach ensures accessibility and convenience for learners worldwide.
Alongside our diverse Online Course Catalogue, encompassing 19 major categories, we go the extra mile by providing a plethora of free educational Online Resources like News updates, Blogs, videos, webinars, and interview questions. Tailoring learning experiences further, professionals can maximise value with customisable Course Bundles of TKA.
What is The Knowledge Pass, and How Does it Work?
The Knowledge Academy’s Knowledge Pass, a prepaid voucher, adds another layer of flexibility, allowing course bookings over a 12-month period. Join us on a journey where education knows no bounds.
What are the Related Courses and Blogs Provided by The Knowledge Academy?
The Knowledge Academy offers various Data Science Courses, including Probability and Statistics for Data Science Training Course and the Predictive Analytics Course. These courses cater to different skill levels, providing comprehensive insights into Big Data Infrastructure & Its Importance.
Our Data, Analytics & AI Blogs cover a range of topics related to Probability and data, offering valuable resources, best practices, and industry insights. Whether you are a beginner or looking to advance your skills related to Probability models, The Knowledge Academy's diverse courses and informative blogs have got you covered.
Upcoming Data, Analytics & AI Resources Batches & Dates
Date
 Probability and Statistics for Data Science Training
Probability and Statistics for Data Science Training
Thu 10th Apr 2025
Probability and Statistics for Data Science Training
Thu 12th Jun 2025
Probability and Statistics for Data Science Training
Thu 14th Aug 2025
Probability and Statistics for Data Science Training
Thu 9th Oct 2025
Probability and Statistics for Data Science Training
Thu 11th Dec 2025
 If you wish to make any changes to your course, please


