We may not have the course you’re looking for. If you enquire or give us a call on 01344203999 and speak to our training experts, we may still be able to help with your training requirements.
We ensure quality, budget-alignment, and timely delivery by our expert instructors.

R Programming Tools stand as a robust and versatile set of resources within the domain of data analysis. With its extensive array of packages and libraries, R programming language empowers data scientists, statisticians, and researchers to glean valuable insights from complex datasets. Data manipulation, advanced statistical analysis, captivating visualisations, and powerful machine learning algorithms become accessible through these tools.
According to Statista, 4.23% of developers worldwide use the R programming language, showing its remarkable capabilities. This programming language and its tools serve as an indispensable asset for elevating your data analysis endeavours. Keep reading this blog, you will learn about the five indispensable R programming tools that can boost your productivity and make you a better Data Analyst.
Table of Contents
1) The role of tools in R programming
a) What are some R Programming tools?
b) Data manipulation with the dplyr package
c) Data visualisation using the ggplot2 package
d) Advanced statistical analysis with stats package
e) Interactive reports with shiny package
2) Conclusion
The role of tools in R programming
R Programming Tools are indispensable in both development practices and data analysis. With a rich collection of packages and libraries, R empowers data scientists, statisticians, and researchers for sophisticated analyses. These tools streamline coding, promote code reusability, and facilitate collaboration.
The efficiency of R's tools in data manipulation, transformation, and cleaning expedites dataset preparation. As a result, meaningful insights can be extracted from complex data, aiding decision-making. R offers a plethora of statistical functions, enabling various hypothesis tests, regression analyses, and time series modelling.
Visualisation capabilities using packages like ggplot2 present data intuitively and effectively. This aids in conveying information and communicating results. R's machine learning tools, including caret, randomForest, and xgboost, build predictive models with high accuracy. These models are vital for solving real-world problems, such as sentiment analysis and customer segmentation. The versatility, ease of use, and vast functionalities of these tools make them invaluable assets for data exploration and analysis. Their continuous evolution ensures they remain a powerful companion for data professionals worldwide.
Interested in becoming a programmer? Try our Programming Training Courses today!
What are R Programming tools?
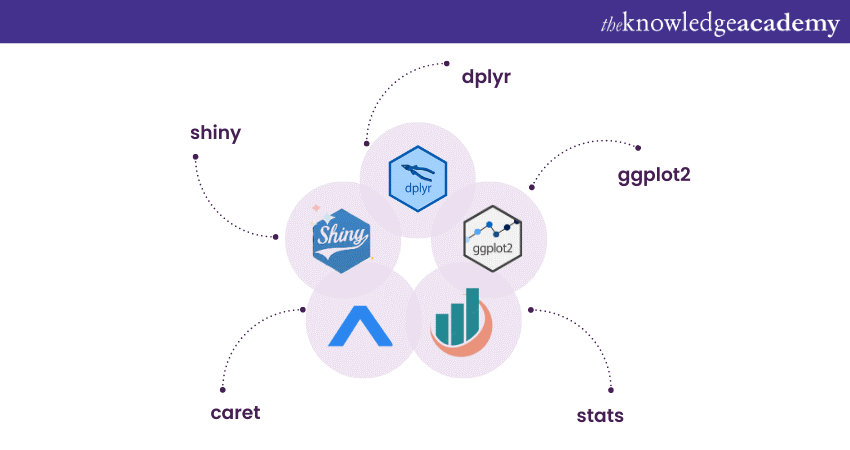
R programming offers a diverse range of tools for data analysis, statistics, visualisation, and machine learning. These tools serve specific roles, making R a versatile language for various data-related tasks, and invaluable for data professionals in different industries and research fields. Here are five frequently used tools in the Advantages of R Programming.

Data manipulation with the dplyr package
The dplyr package is a highly efficient and user-friendly tool for data manipulation in R. It’s straightforward syntax and powerful functions, such as filter, select, mutate, and group_by, make data wrangling a breeze. By using dplyr, data scientists can easily clean, filter, and reshape datasets, preparing them for further analysis.
The dplyr package's seamless integration with other packages like ggplot2 and tidyr enhances its versatility, enabling users to create comprehensive data pipelines. With a strong foundation in Variables in R Programming, dplyr allows users to efficiently filter rows, select specific columns, and aggregate data. Its intuitive approach significantly improves workflow and enhances data exploration.
In real life, Data Analysts use dplyr to filter customer data for targeted marketing campaigns, summarise sales figures for quarterly reports, and transform survey data for meaningful insights.
Data visualisation using the ggplot2 package
The ggplot2 stands out as a powerful and flexible tool for creating captivating visualisations in R. Based on the "Grammar of Graphics," ggplot2 allows users to build complex plots by combining different graphical elements. Its layering system enables data scientists to add multiple geoms, facets, and aesthetic mappings to generate intricate and informative visualisations.
With its wide range of supported plot types, customization options, and themes, ggplot2 showcases the features of R programming by providing an exceptional platform for exploring data patterns and trends. Whether you're creating scatter plots, bar charts, boxplots, or more complex visualizations, ggplot2 empowers users to produce publication-ready graphics with ease.
Data visualisation experts employ ggplot2 to create stunning charts and graphs for presenting sales trends, visualising geographical data for market analysis, and displaying survey results with informative plots.
Interested in the R programming language? Try our R Programming Course!
Advanced statistical analysis with the stats package
The built-in stats package in R serves as a fundamental tool for conducting a variety of statistical analyses. It encompasses a diverse collection of functions, covering essential statistical methods such as hypothesis testing, linear and nonlinear regression, analysis of variance (ANOVA), and correlation analysis.
The Updating Rlang process ensures compatibility and efficiency when working with the stats package, which is widely used by researchers and Data Analysts for its accuracy and reliability in statistical computations. By leveraging these functions, users can draw meaningful insights from data, make data-driven decisions, and derive valuable conclusions from research studies. Whether you are analyzing experimental data, conducting surveys, or exploring population trends, the stats package provides the necessary tools for sound statistical analysis.
Researchers apply stats for hypothesis testing in clinical trials, conducting regression analysis to study the impact of variables, and analysing survey data to identify significant correlations.
Machine learning with the caret package
The caret (Classification And REgression Training) package is a comprehensive toolset that simplifies the process of building and evaluating machine learning models in R. One of its main advantages is its unified interface to multiple algorithms, enabling users to apply a variety of techniques without the need to learn the specific syntax for each model. The caret tool supports a wide range of classification, regression, and clustering algorithms, making it suitable for diverse machine learning tasks.
This tool offers various preprocessing options for data scaling, imputation, and feature selection, facilitating data preparation before model training. The package's robust functionalities for cross-validation and model tuning empower users to select the best-performing model with confidence, ensuring accurate predictions and successful machine-learning applications.
Machine learning practitioners use caret to build predictive models for customer churn prediction, sentiment analysis of social media data, and classification of images for medical diagnosis.
Interactive reports with the shiny package
The shiny package opens a new dimension of data exploration and communication by enabling users to build interactive web applications directly from R code. With shiny, data scientists and analysts can create dynamic and customisable dashboards and reports that allow users to interact with data in real-time.
This powerful tool integrates data analysis, visualisation, and user interface (UI) design to deliver an engaging and intuitive experience for end-users. The shiny applications can be easily hosted on web servers, making them accessible from anywhere. By leveraging shiny, users can present their findings, insights, and results in a visually appealing and interactive format, fostering greater understanding and engagement among stakeholders and collaborators.
Data scientists develop interactive dashboards with shiny to showcase real-time financial market data, provide self-service analytics for business users, and visualise election results with dynamic charts and maps.

Conclusion
As we conclude the blog, we hope you learned that R Programming Tools for Advanced Data Analysis equip data professionals with powerful capabilities in data manipulation, visualisation, statistics, machine learning, and interactive reporting. Understanding Data Types in R Programming is fundamental to harnessing these tools, as it helps in organizing and processing data effectively to uncover valuable insights. Additionally, reviewing R Programming Interview Questions can further strengthen your understanding and prepare you for technical assessments in the field.
Learn all about programming in D with our course in D Programming Language Training!
Upcoming Programming & DevOps Resources Batches & Dates
Date
 R Programming Course
Fri 27th Jun 2025
Fri 29th Aug 2025
Fri 24th Oct 2025
Fri 5th Dec 2025


 Top Rated Course


 If you wish to make any changes to your course, please


