


 Top Rated Course

We may not have the course you’re looking for. If you enquire or give us a call on 01344203999 and speak to our training experts, we may still be able to help with your training requirements.
Fishbone Diagram in Root Cause Analysis: A Comprehensive Guide
Sophia Ellis 19 July 2023Explore the power of Root Cause Analysis Fishbone Diagrams and learn how this insightful tool unravels complex problems by breaking them down. Learn how these problems are broken down into their fundamental causes. Read this blog and find out how you pinpoint the underlying issues. Let's delve in!

Training Outcomes Within Your Budget!
We ensure quality, budget-alignment, and timely delivery by our expert instructors.
Table of Contents
Today’s competitive business landscape has caused organisations to improve their processes and achieve optimal performance constantly. However, achieving these goals can be very challenging without thoroughly understanding the Root Causes behind problems. This is why organisations are turning towards using the Fishbone Diagram in Root Cause Analysis.
Root Cause Analysis Fishbone is a visual tool used to explore and identify the potential root causes of a problem, allowing for targeted and effective solutions. However, if you haven’t started using this comprehensive tool, it’s time to incorporate it into your improvement processes.
Don’t know what a Fishbone is, how it is used, and its benefits? Worry no more. Read this blog to learn about the Fishbone Diagram in Root Cause Analysis. Also, explore how you can create this tool effectively.
Table of Contents
1) What is a Fishbone Diagram?
2) Steps to create a Fishbone Diagram
3) Example of a Fishbone diagram
4) Advantages and disadvantages of Fishbone Diagram Root Cause Analysis
5) Conclusion
What is a Fishbone Diagram?
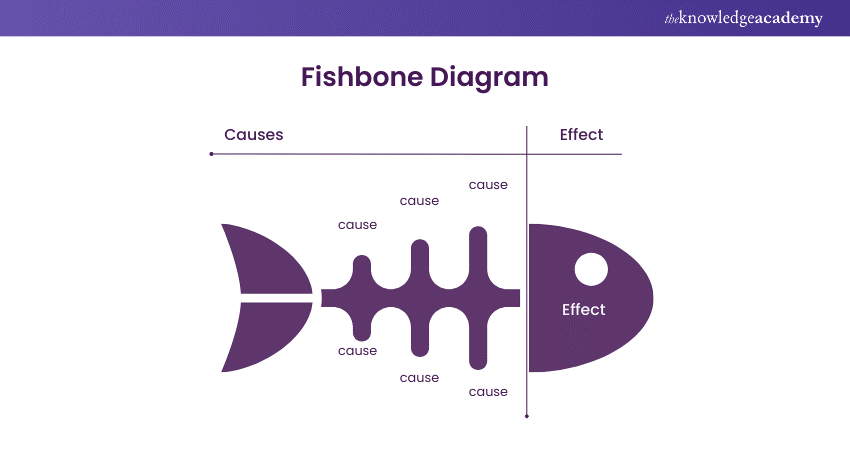
A Fishbone Diagram also referred to as a Cause-and-effect Diagram or Ishikawa Diagram, is one of the best Root Cause Analysis Tools. It uses a visual means to identify and analyse the potential causes contributing to a problem or outcome. The diagram gets its name from its distinct shape, resembling a fish's skeletal structure.
It also gives a structured approach to problem-solving by visually mapping out the different factors that can influence an issue. Further, the diagram helps teams and individuals systematically explore and understand the potential causes across multiple dimensions or categories. These categories are typically represented as branches that are extending from the main horizontal line, resembling the spine of the Fishbone.
The main purpose of a Fishbone Diagram is to identify the Root Cause or causes that are at the core of a problem. By analysing the contributing factors in a structured manner, the Diagram helps uncover the underlying causes rather than merely addressing the symptoms. This approach enables organisations to implement targeted and effective solutions, leading to long-lasting improvements.

Steps to create a Fishbone Diagram
Crafting a Root Cause Analysis Fishbone is a structured and systematic process encompassing a series of critical steps. These steps are designed to facilitate an easy identification and examination of the potential causes of a problem. Here’s a detailed breakdown of each step involved in the process:
a) Identify the problem: The first step is clearly defining and articulating the problem you want to address. Ensure that the problem statement is specific and concise. This step lays the major foundation for the entire Fishbone analysis process.
b) Identify the major categories: Once you have identified the problem, the next step is to determine your Diagram's major categories or branches. The common categories, also known as the 5 M's, are Manpower, Method, Machine, Material, and Measurement. These categories cover multiple factors that can influence a problem. However, depending on the nature of the problem, you can customise or add additional categories relevant to your specific situation.
c) Brainstorm possible causes: In this step, gather diverse stakeholders or team members with knowledge and insights about the problem. Encourage open discussion and brainstorming to generate a comprehensive list of potential causes within each category. Use the branches of the Diagram to record these causes.
d) Identify sub-causes: Once you have brainstormed the possible causes, analyse each cause further to identify sub-causes or contributing factors. This step helps break down the causes into more specific elements and provides a deeper understanding of the factors influencing the problem. Add the sub-causes as smaller branches stemming from the main causes on the Fishbone Diagram.
e) Analyse and prioritise causes: After listing all the causes and sub-causes, it's time to analyse and evaluate their relevance and impact on the problem. Assess the causes based on available data, expert opinions, and their potential to contribute to the problem. Further, prioritise the causes that are most likely to be the Root Cause. This step helps focus your efforts on investigating and addressing the most critical causes.
Ready to level up your ITIL skills? Explore our comprehensive ITIL® Certification Training now!
Example of a Fishbone Diagram
A Fishbone Diagram visually resembles the skeleton of a fish, hence the name Fishbone. This Diagram is represented by a central "spine" and several "bones" branching off representing different categories of Root Causes.
For instance, consider a manufacturing company facing a quality issue with one of its products, such as a high rate of defects. The central spine of the Fishbone Diagram would primarily state the problem: "High rate of product defects." Branching off the spine, the major categories might include Machines, Methods, Materials, Manpower, Measurements, and Environment, each representing a potential source of variation or cause for the defects. Here's what a Root cause Analysis Fishbone Diagram will look like:
Advantages and disadvantages of Fishbone Diagram Root Cause Analysis
Fishbone Diagram in Root Cause Analysis offers several advantages and disadvantages in identifying and addressing the underlying causes of problems. So, let’s explore the benefits and limitations of RCA using this Diagram:
Advantages
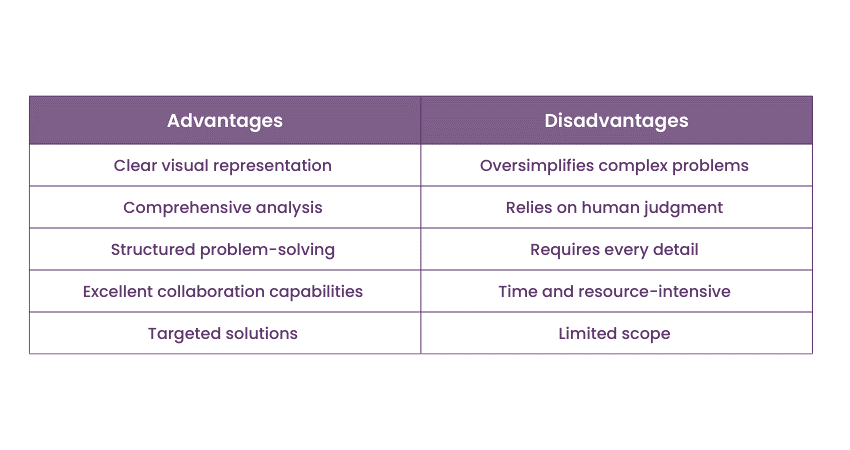
The following are the various advantages of using the Fishbone Diagram in Root Cause Analysis:
a) Visual representation: Fishbone Diagrams clearly show cause-and-effect relationships that improve communication and collaboration.
b) Comprehensive analysis: They facilitate a detailed investigation of all possible reasons, helping to exclude any substantial factors.
c) Structured problem-solving: The diagrams also provide a simplified way of solving complex problems, improving the speed and success of the process.
d) Team collaboration: They foster teamwork and collaboration by allowing different perspectives to work towards the problem analysis.
e) Targeted solutions: This way of looking at things lets organisations concentrate on the basic problems and, in turn, implement the right solutions targeted to the problem's core.
Learn how to manage IT-enabled services with our ITIL® 4 Foundation Certification Course.
Disadvantages
The following are the various disadvantages of using the Fishbone Diagram in Root Cause Analysis:
a) Simplification of complex problems: Fishbone Diagrams may oversimplify complex problems, potentially overlooking interdependencies and interactions between causes.
b) Subjectivity in cause identification: The process relies on human judgment and brainstorming, introducing biases and variations in cause selection and prioritisation.
c) Data availability and accuracy: Inaccurate or unavailable data can impact the effectiveness of the Diagram, requiring proper data collection and analysis.
d) Time and resource-intensive: Creating a Fishbone Diagram and conducting Root Cause Analysis can be time and resource-intensive, requiring dedicated efforts.
e) Limited scope: These Diagrams are most suitable for analysing specific problems within a defined scope and may not address complex or systemic issues.
Enhance your skills with Certified Lean IT Training in the UK. Boost efficiency and drive continuous improvement. Join today!
Conclusion
The Root Cause Analysis Fishbone tool is a valuable tool for identifying and analysing the underlying causes of problems. Its visual representation and comprehensive analysis make it an effective tool in driving continuous improvement. By leveraging the strengths of this tool, organisations can effectively solve problems, innovate solutions, and sustainably improve themselves.
Take the next step in your career and improve your problem-solving capabilities with our Root Cause Analysis Course.
Frequently Asked Questions
How can organisations encourage the widespread use of the Fishbone Diagram for problem-solving?

Organisations can encourage the widespread use of the Fishbone Diagram by offering training sessions to employees, incorporating it into standard problem-solving procedures, promoting its benefits in internal communications, and recognising successful outcomes achieved through its application.
How can incorporating Fishbone Diagram expertise improve job performance and efficiency?
Incorporating Fishbone Diagram expertise can improve job performance and efficiency by fostering a systematic approach to identifying the Root Causes of issues. It enhances analytical skills, encourages collaborative problem-solving, and streamlines decision-making processes.
What are the other resources and offers provided by The Knowledge Academy?
The Knowledge Academy takes global learning to new heights, offering over 30,000 online courses across 490+ locations in 220 countries. This expansive reach ensures accessibility and convenience for learners worldwide.
Alongside our diverse Online Course Catalogue, encompassing 17 major categories, we go the extra mile by providing a plethora of free educational Online Resources like News updates, Blogs, videos, webinars, and interview questions. Tailoring learning experiences further, professionals can maximise value with customisable Course Bundles of TKA.
What is Knowledge Pass, and how does it work?
The Knowledge Academy’s Knowledge Pass, a prepaid voucher, adds another layer of flexibility, allowing course bookings over a 12-month period. Join us on a journey where education knows no bounds.
What are related courses and blogs provided by The Knowledge Academy?
The Knowledge Academy offers various ITIL® Certification Training, including Root Cause Analysis, ITIL® 4 Specialist: Create Deliver and Support CDS Course, and ITIL® 4 Strategist: Direct, Plan and Improve DPI Course. These courses cater to different skill levels, providing comprehensive insights into Root Cause Analysis Interview Questions.
Our IT Service Management blogs covers a range of topics related to Root Cause Analysis, offering valuable resources, best practices, and industry insights. Whether you are a beginner or looking to advance your RCA skills, The Knowledge Academy's diverse courses and informative blogs have you covered.
Upcoming IT Service Management Resources Batches & Dates
Date
 Root Cause Analysis
Root Cause Analysis
Fri 7th Feb 2025
Root Cause Analysis
Fri 30th May 2025
Root Cause Analysis
Fri 29th Aug 2025
Root Cause Analysis
Fri 28th Nov 2025
 If you wish to make any changes to your course, please


