


 Top Rated Course

We may not have the course you’re looking for. If you enquire or give us a call on 01344203999 and speak to our training experts, we may still be able to help with your training requirements.
Top 8 Root Cause Analysis Tools for Problem-Solving
Sophia Ellis 19 July 2023Explore the world of "Root Cause Analysis Tools" in this informative blog. Dig into the core methods that would enable us to detect the roots instead of just the symptoms of the issues. Discover essential techniques like the Fishbone Diagram, 5 Whys, Fault Tree Analysis, FMEA, Pareto Analysis, Scatter Diagram, Histograms, and Control Charts.

Training Outcomes Within Your Budget!
We ensure quality, budget-alignment, and timely delivery by our expert instructors.
Table of Contents
The most popular of the tools used in the area of quality improvement and problem solving by every practitioner is a root cause analysis. It is a critical process that is meant to find the underlying reasons of the problems, not the symptoms. But what do you know that makes the process so effective? It's the various Root Cause Analysis Tools.
Interested in finding out about these tools and the role they play in making RCA successful? Read this blog in order to be familiar with different Root Cause Analysis Tools. Also, explore their key features and how they work to perform RCA.
Table of Contents
1) What are the Root Cause Analysis Tools?
a) Fishbone Diagram
b) 5 Whys
c) Pareto Analysis
d) Failure Mode and Effects Analysis (FMEA)
e) Fault Tree Analysis
f) Scatter Diagram
g) DMAIC Template
h) 8D Report Template Checklist
2) Conclusion
What are the Root Cause Analysis Tools?
RCA or Root Cause Analysis relies on a comprehensive methodology for understanding the basic reasons of failures or mishaps. With the advent of different Root Cause Analysis Tools, the identification of causes has become faster and more efficient.
Such tools offer well-defined approaches to aid organisations to explore issues in detail and understand the underlying problems. So, let's explore some of the most common tools used for RCA:
1) Fishbone Diagram
The Fishbone Diagram is also called the Ishikawa or Cause-and-effect Diagram. This is a visual tool that helps identify potential causes contributing to a problem. It displays causes categorically, resembling the shape of a fishbone. The main categories typically include people, methods, machines, materials, measurements and environment. The structure of a Fishbone Diagram may look something like this:
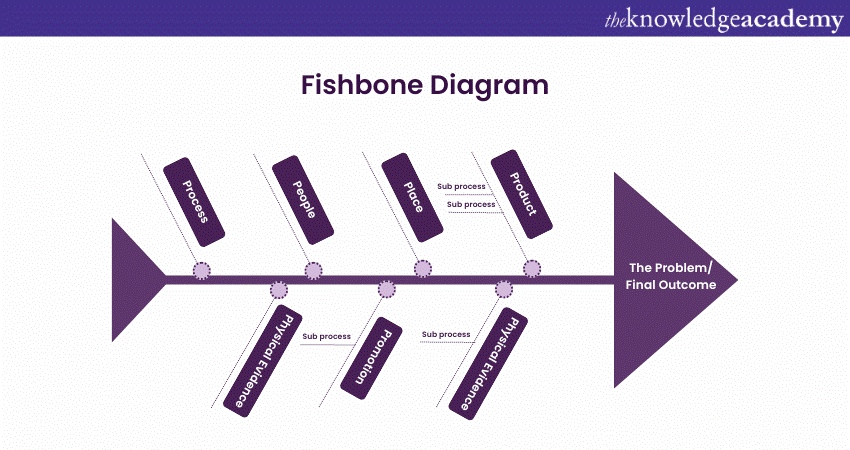
The structure of a Fishbone Diagram consists of the following key components:
a) Head: The head of the diagram represents the problem or effect that needs to be analysed.
b) Main backbone: This is a horizontal line that extends from the head towards the left side of the diagram. It symbolises the problem or effect being investigated.
c) Categories: Branching off from the main backbone are several diagonal lines resembling a fish's bones. These lines represent different categories of potential causes that could contribute to the problem.
d) Subcategories: Each category line further splits into smaller branches, forming subcategories. These subcategories provide a more detailed breakdown of potential causes within each category.
e) Potential causes: Potential causes are sub-branch of subcategories that are brainstormed and identified by the team conducting the analysis.
f) Cause and effect relationships: A tree-like structure aids in a more organized way of unpacking the probable causes, showing the connection between those elements to the problem under investigation.
Thus, the Fishbone Diagram enables the brainstorming and analysis of the factors that affect the problem through an all-round understanding.
2) The 5 Whys method
The goal of this strategy is to answer the question "Why?" repeated five times in the hope of finding the appropriate cause to the problem. It is an instrument which was created thereby to explore the cause and effect and challenge critical thinking. By exploring the matter, it delves deep enough to get to the cause of the problem which needs to be addressed. Here is a simple example of how the 5 Whys Root Cause Analysis technique works:
Problem: The production output has decreased.
1) Question: Why did the production output decrease?
Solution: Because the machines are frequently breaking down.
2) Question: Why are the machines breaking down?
Solution: Because they have not been properly maintained.
3) Question: Why have the machines not been properly maintained?
Solution: Because there is no regular maintenance schedule in place.
4) Question: Why is there no regular maintenance schedule in place?
Solution: Because the maintenance department lacks sufficient resources.
5) Question: Why does the maintenance department lack sufficient resources?
Solution: Because the budget allocated for maintenance has been reduced.
3) Pareto Analysis
Pareto Analysis is a critical technique within Root Cause Analysis (RCA), which helps pinpoint the main contributors to a problem. It's rooted in the Pareto Principle, often referred to as the 80/20 rule, suggesting that approximately 80% of problems arise from 20% of the causes.
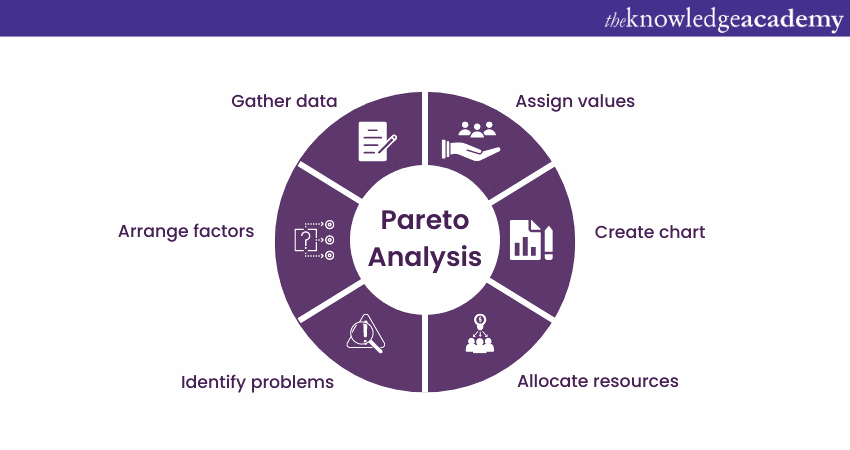
When applying Pareto Analysis in RCA, it starts by gathering data on different potential causes, such as defects or errors in a process. These are then grouped and measured by their frequency or impact. This data is visually represented in a Pareto chart, which ranks causes from most to least significant. The chart uses bars to show the frequency or impact of each cause and includes a cumulative line indicating the combined percentage.
This visualisation is particularly useful because it highlights the "vital few" causes that lead to the majority of the problem, distinguishing them from the "trivial many" that have a minor impact. By concentrating on these critical areas, organizations can focus their resources where they will have the most effect, enhancing problem-solving and making process improvements more impactful.
In essence, Pareto Analysis provides a structured method for organizations to drill down into the primary causes of their issues, ensuring that efforts to implement corrective actions are well-targeted and effective.
Explore our comprehensive ITIL Courses today to elevate your skills and advance your career in IT service management.
4) Failure Mode and Effects Analysis (FMEA)
The Failure Mode and Effect Analysis (FMEA) is a method focused on identifying failures within a specific system. It can be utilised at various stages of a project, such as designing, implementation, planning, and inspection. FMEA comprises two key components: Failure Mode and Effect Analysis.
In the Failure Mode component, the objective is to identify the various ways in which a system can fail. Effect Analysis, on the other hand, examines the consequences of these failure modes.
For instance, consider an automated teller machine (ATM) which is required to dispense cash when a customer requests it. A potential failure mode could involve the ATM dispensing an incorrect amount of money or failing to dispense any cash at all.
This tool further involves systematically analysing failure modes, their causes, and the potential impact of these failures. It works in the following manner:
a) Break down the process or system into components.
b) Identify potential failure modes for each component.
c) Evaluate the impact or severity of each failure.
d) Assign a severity rating.
e) Determine root causes, considering design flaws, human error, etc.
f) Assess the likelihood of each failure occurring.
g) Assign an occurrence rating.
h) Evaluate the ability to detect each failure mode.
i) Assign a detection rating.
j) Compute the Risk Priority Number (RPN) by multiplying severity, occurrence, and detection ratings.
k) Prioritise issues with the highest RPN and address their root causes.
l) Develop strategies to prevent or minimise these failures.
Enhance your IT Service Management skills with our ITIL® Certification Training.
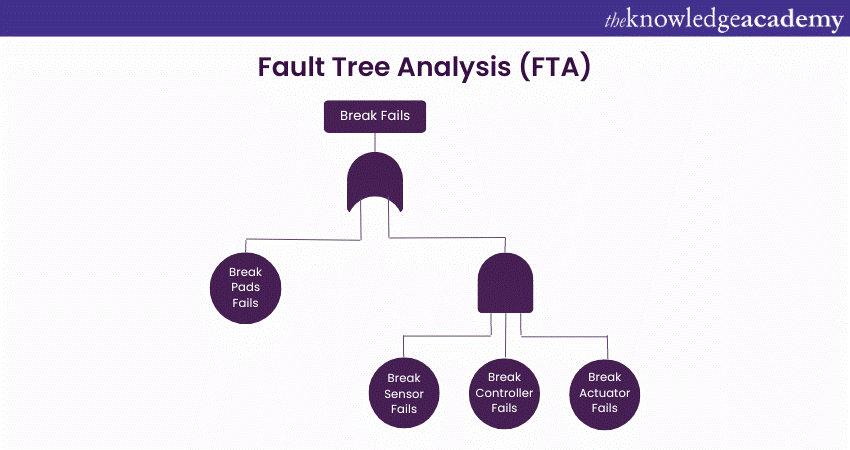
5) Fault Tree Analysis (FTA)
Fault Tree Analysis (FTA) is a deductive, systematic method to identify causes of failures or undesired events. It adopts the graphical diagramming method that depicts the logical relations that join the events and conditions that can end up leading to failure.
This tool works in the following manner:
a) Identifies system failure that needs to be analysed
b) Breaks down the failure into specific events that could contribute to the system failure
c) Creates a Fault Tree diagram that visually represents the relationships between events and causes using logical gates (AND, OR).
d) Determines probability of events and causes based on historical data, expert knowledge, or estimation
e) Calculates the probability of the top-level system failure by propagating probabilities through the fault tree using Boolean logic
f) Identifies the events or causes with the highest probability of contributions to the system failure.
g) Analyses the critical events to determine appropriate mitigation strategies and preventive measures.
h) Implements the identified measures to address the Root Causes and reduce the likelihood of system failures.
Get in-depth knowledge of the responsibilities of an IT Service Manager with our Certified IT Service Manager CITSM Course
6) Scatter Diagram
A Scatter Diagram, or Scatter Plot, is one of the widely used Root Cause Analysis Tools. It is used to investigate and understand the potential relationship between two variables. It helps RCA by providing the following:
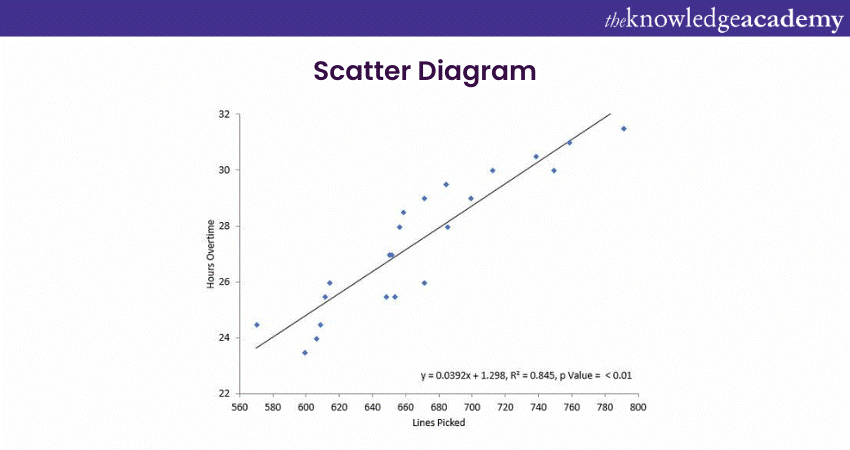
a) Visual representation: The visual display of data points enables quick observation of patterns, trends, or correlations between two variables.
b) Identification of relationships: Identifying whether variables are positively or negatively correlated or if there is no apparent correlation provides insights into potential relationships between variables.
c) Identification of outliers: Highlighting outliers indicates unusual circumstances or factors that may contribute to the problem. This aids in the identification of potential root causes.
d) Exploration of cause-and-effect relationships: Facilitating the exploration of cause-and-effect relationships between variables helps analysts hypothesise about the influence of one variable on the other.
e) Comparison of data sets: Allowing comparison of data sets enables analysts to assess differences in patterns, trends, or correlations between different sets of variables.
Take your first step towards becoming an ITIL expert. Join our ITIL® 4 Foundation Certification Training Course today!
7) DMAIC Template
The DMAIC template is a highly structured approach that provides a framework for processing and tackling the problems arising in multiple processes. Every letter of the acronym refers to a different step in problem-solving procedure. They are as follows:
D- Define
Define is the first step in DMAIC. In this stage, team members identify and articulate a specific problem or goal. The purpose here is to set a clear understanding of the issue so that the team may focus on it.
M- Measure
This phase focuses on tracking or measuring the problem using specific metrics. It’s normal to use tools like Pareto charts on a project to pinpoint important areas that need attention. It helps to track progress over time.
A- Analyse
Analysing is the next step. You can break down the possible causes of problems that you are dealing with using root cause analysis. This can help prevent the issue from happening again in the future. Sometimes, the root causes are unknown. In those cases, it is important to list out and prioritise the potential causes to tackle them efficiently.
I- Improve
This stage aims at examining the performance improvements that could be used to eliminate some of the root causes of issues. During this stage, all improvements should lead to positive changes. Otherwise, they should be reconsidered or replaced with more suitable solutions.
C- Control
Control is an approach to management that is both powerful and systematic in nature. This final component is important for landing and maintaining the outcomes achieved through the former stages and ensuring that these outcomes are long-standing. Moreover, it prevents waste of time and unnecessary efforts and helps organisation to monitor performance against its targets and goals.
8) 8D Report Template Checklist
The 8D report template checklist is a comprehensive tool designed to document root-cause analysis using the eight disciplines of problem-solving. The 8D method involves a series of structured steps to effectively address and resolve issues that arise. Here’s an expanded explanation of each step:
1) Establish a team: Create a multidisciplinary team specifically tasked with addressing issues and finding effective solutions. This team should include members with diverse skills and knowledge relevant to the problem at hand.
2) Define the problem: Clearly articulate the problem before attempting to solve it. This involves gathering detailed information and evidence to understand the scope and impact of the issue.
3) Contain the problem: Implement immediate actions to contain the problem, ensuring that it does not disrupt daily business operations. The objective is to minimise the impact and prevent the problem from escalating or causing further complications.
4) Find the Root Cause: Conduct a thorough root cause analysis to identify the underlying cause of the problem. Use techniques such as the 5 Whys or Fishbone Diagram to systematically drill down to the core issue.
5) Define corrective measures: Develop and implement appropriate corrective actions to address the root cause. These measures should be designed to eliminate the problem and prevent its recurrence.
6) Track progress: Monitor and document the progress of the corrective actions. Keeping a detailed record ensures that the implementation is effective and any adjustments can be made in a timely manner.
7) Establish preventative measures: Put in place preventative measures to avoid future occurrences of the problem. This may involve revising processes, improving training, or implementing new controls.
8) Recognise the team: Acknowledge and reward the team’s efforts and successes in resolving the issue. Recognising the team’s hard work fosters a culture of continuous improvement and teamwork.
The goal of finalising an 8D report within eight days serves as a benchmark for timely problem resolution, though it may not always be feasible. Striving for this timeline encourages efficiency and prompt action in addressing and resolving issues
Get certified with the COBIT® Foundation course today and enhance your IT governance skills for better business outcomes!
Conclusion
The use of various Root Cause Analysis Tools provides valuable insights and a structured approach to uncovering the root causes. Through consistent application of these set of tools, companies can develop sustainable and resilient growth models that will stand the test of time.
Learn how to identify, control and manage root cause problems with our Root Cause Analysis Course.
Frequently Asked Questions
Can learning Root Cause Analysis tools open up new career opportunities?

Yes, mastering Root Cause Analysis (RCA) Tools can unlock new career paths by enhancing problem-solving skills, critical for roles in Project Management, quality assurance, and operations, making you a valuable asset across industries.
How do these tools contribute to effective problem-solving?
Root Cause Analysis (RCA) Tools help in identifying the underlying reasons for problems, allowing for effective solutions by eliminating symptoms' sources rather than just addressing the immediate issues, leading to long-term improvements and preventive strategies.
What are the other resources and offers provided by The Knowledge Academy?
The Knowledge Academy takes global learning to new heights, offering over 30,000 online courses across 490+ locations in 220 countries. This expansive reach ensures accessibility and convenience for learners worldwide.
Alongside our diverse Online Course Catalogue, encompassing 17 major categories, we go the extra mile by providing a plethora of free educational Online Resources like News updates, Blogs, videos, webinars, and interview questions. Tailoring learning experiences further, professionals can maximise value with customisable Course Bundles of TKA.
What is Knowledge Pass, and how does it work?
The Knowledge Academy’s Knowledge Pass, a prepaid voucher, adds another layer of flexibility, allowing course bookings over a 12-month period. Join us on a journey where education knows no bounds.
What are related courses and blogs provided by The Knowledge Academy?
The Knowledge Academy offers various ITIL® Certification Training, including Root Cause Analysis, ITIL® 4 Specialist: Create Deliver and Support CDS Course, and ITIL® 4 Strategist: Direct, Plan and Improve DPI Course. These courses cater to different skill levels, providing comprehensive insights into Root Cause Analysis Interview Questions and Answers.
Our IT Service Management blogs cover a range of topics related to Root Cause Analysis, offering valuable resources, best practices, and industry insights. Whether you are a beginner or looking to advance your RCA skills, The Knowledge Academy's diverse courses and informative blogs have you covered.
Upcoming IT Service Management Resources Batches & Dates
Date
 Root Cause Analysis
Root Cause Analysis
Fri 7th Feb 2025
Root Cause Analysis
Fri 30th May 2025
Root Cause Analysis
Fri 29th Aug 2025
Root Cause Analysis
Fri 28th Nov 2025
 If you wish to make any changes to your course, please


