We may not have the course you’re looking for. If you enquire or give us a call on 01344203999 and speak to our training experts, we may still be able to help with your training requirements.
We ensure quality, budget-alignment, and timely delivery by our expert instructors.
In the modern world of sales, data is the gold and Sales Analytics is your guiding light towards the goldmine of business success. From optimising sales strategies and making data-driven decisions to strengthening customer relations and spotting new opportunities, Sales Analytics techniques and tools are a modern business's most powerful allies.
This blog explores what is Sales Analytics, uncovering the secret to tapping into customer behaviours, forecasting trends and elevating sales strategies from ordinary to extraordinary. So read on and amplify your business's sales potential.
Table of Contents
1) What is Sales Analytics?
2) Benefits of Sales Analytics
3) Key Components of Sales Analytics
4) Steps to Conduct a Sales Data Analysis
5) Forecasting and Predictive Analytics With Sales Analytics
6) Key Features to Look for in Sales Analytics Tools
7) Conclusion
What is Sales Analytics?
Sales Analytics refers to any technology and processes used to assemble sales data and analyse sales performance. Sales leaders leverage these metrics to set goals, improve internal processes, and accurately forecast future sales and revenue. The goal of Sales Analytics is to simplify the information available to you. It must help clearly understand the team’s performance, sales trends, and opportunities.
Benefits of Sales Analytics
Sales Analytics offers numerous benefits to enhance business operations and decision-making processes. Here are some key advantages:
1) Identifying Trends: Sales Analytics helps businesses identify patterns in sales data and spot trends, allowing them to understand the state of business and make predictions about future sales and market behaviour.
2) Optimising Sales Strategies: Different customers and products may necessitate different sales strategies. Analytics can help determine the most effective approaches for each scenario. Additionally, it helps monitor the performance of individual sales representatives.
3) Making Data-driven Decisions: Sales Analytics provide insights for both strategic and day-to-day decisions and use data to make more informed decisions about pricing, inventory, and marketing.
4) Enhancing Customer Relationships: Sales Analytics enable businesses to tailor sales effort to meet specific needs and preferences of high-value prospects and understand customer behaviour.
5) Increasing Productivity: It helps identify bottlenecks and inefficiencies in sales processes and enables more effective resource allocation based on data-driven insights.
6) Spotting New Opportunities: Sales Analytics help businesses discover new market opportunities, identify gaps in the market, and innovate their product offerings accordingly.
Master the skills of successful salespeople with our Sales Training. Start achieving better results today. Sign up now!
Key Components of Sales Analytics
Sales Analytics is a multifaceted discipline comprising several components, each of which contribute to a comprehensive understanding of customer behaviour and sales performance. These components work together, transforming raw data into actionable insights. These key components are explored below:
1) Data Collection
Relevant data collection is at the core of Sales Analytics. This involves gathering diverse information from various sources, including sales transactions, customer interactions, marketing campaigns, and external market data. Data can be structured (quantitative metrics) or unstructured (customer feedback), and both are essential to gain a holistic view.
2) Data Processing
Raw data is often scattered and unorganised. This is why data processing involves cleaning and structuring the collected data to ensure they are accurate and consistent. This step lays down a reliable foundation for analysis.
3) Data Analysis
This involves application of statistical techniques and algorithms to detect patterns, trends, and relationships within the data. It helps in the identification of key performance indicators (KPIs), customer preferences, and gauge the effectiveness of sales strategies.
4) Data Interpretation
Analysts are tasked with translating complex statistical findings into understandable narratives that guide decision-makers. Interpretation involves answering questions such as “What do these numbers mean for the company's sales approach?” and “How can the company improve based on this analysis?”
5) Integration of Data Sources
Sales Analytics thrives on integrating data from various sources. Point-of-sale systems, customer Relationship Management (CRM) systems, Social Media platforms and website analytics contribute invaluable data points. This allows businesses to better understand the entire customer journey.
6) Utilising Advanced Technologies
Advanced and evolving technologies such as Artificial Intelligence (AI) and Machine Learning (ML) have revolutionised Sales Analytics. AI-powered algorithms can segment audiences, predict customer behaviour, and recommend personalised sales strategies. The best thing about these technologies is that they continuously learn from data, helping them refine their predictions and recommendations over time.
7) Segmenting Customers
Sales Analytics help businesses segment their customers based on attributes such as purchase history and demographics. This segmentation helps create tailored sales approaches, marketing messages and offers to specific customer groups
8) Monitoring Sales Performance
Regular monitoring is essential for tracking the effectiveness of sales strategies over time. Continuously analysing data allows businesses to adapt to market changes, identify shifts in customer behaviour, and make prompt adjustments to sales tactics.
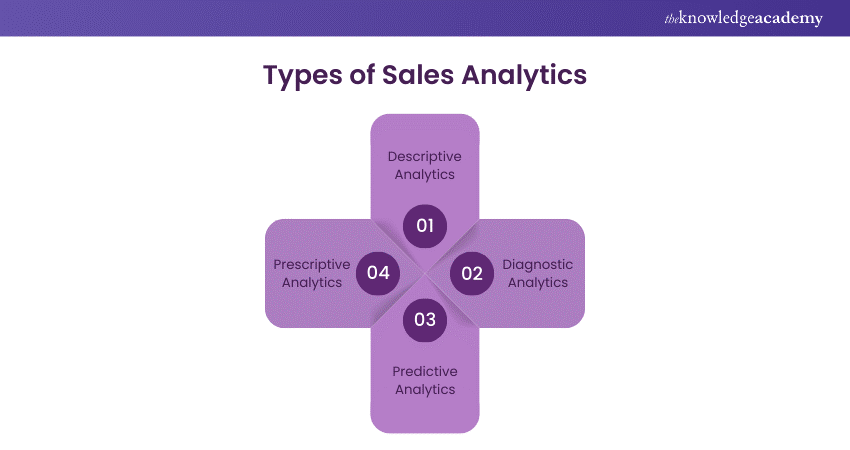
9) Predictive and Prescriptive Analysis
In Sales Analytics, understanding the past helps anticipate future success. Predictive analysis uses historical data to forecast future outcomes and prescribes actionable strategies to achieve the same.
10) Visualising Data and Generating Reports
Assembling complex data into clear, visual reports is vital for effective communication. Dashboards and visualisations provide a snapshot of sales performance, making it easier for decision-makers to quickly grasp insights.
Want to gain expertise on customer relationship management and grow client bases? Sign up for our comprehensive Sales Management Training now!
Steps to Conduct a Sales Data Analysis
Now that the benefits and components of Sales Analytics have been covered, let’s explore the essential steps to conduct a sales data analysis. These steps encompass everything from setting measurable goals and leveraging visualisation tools to automating sales data with analytics software
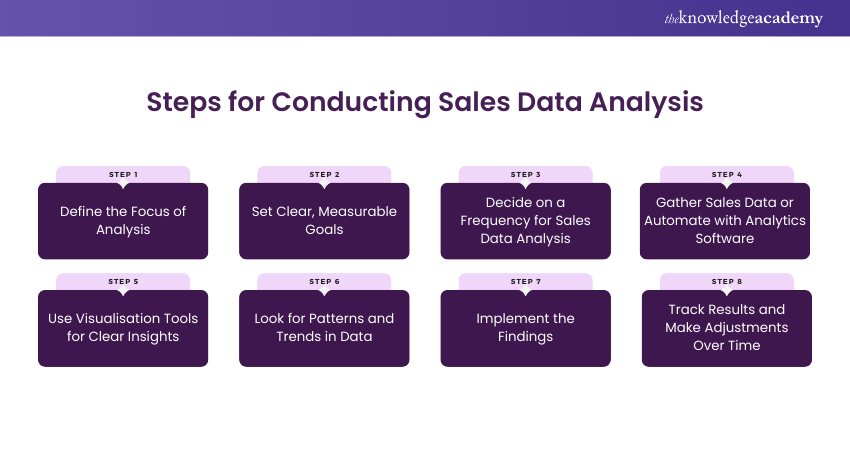
1) Define the Focus of Your Analysis
A sales data analysis reveals information about product, department, campaign, team, or rep performance. A clear focus can streamline a business's analysis efforts and uncover valuable insights specific to the objectives.
Relevant metrics like average deal size, conversion rates, or customer acquisition costs can help gain deeper sales insights and measure success effectively. These key performance indicators (KPIs) drive data-driven decision-making and enhance sales strategy.
2) Set Clear, Measurable Goals
This step is especially valuable for businesses recently conducting promotional campaigns, such as month-long sales with discounted prices. Clear benchmarks and metrics must be set to ensure focused objectives for sales data analysis. This enables effective tracking and evaluation of promotional campaign success, providing insights to inform future strategies.
3) Decide on a Frequency for Sales Data Analysis
The frequency at which a business reviews data will vary depending on the nature of the analysis. Data can be measured weekly, monthly, quarterly, or even daily. Some Sales Analytics reports will require ongoing monitoring for future reference.
For example, determining the frequency of sales data analysis is crucial for a retail business running a month-long marketing campaign. By reviewing the data weekly during the campaign and comparing it with monthly data from previous periods, progress can be tracked, trends identified, and timely adjustments made to maximise its effectiveness.
4) Gather Your Sales Data or Automate with Analytics Software
While manually compiling sales data is still possible, CRMs and Sales Analytics software are more desirable options today. A CRM helps expedite the process of accruing sales data and allows the quick tracking of individual customer information.
Furthermore, many of these tools offer resources to log sales team performance. To streamline the compilation of sales data, leveraging a CRM that offers strong features for tracking customer information and sales team performance is advisable.
5) Use Visualisation Tools for Clear Insights
Sales Analytics software typically includes data visualisation resources, enabling salespeople to comprehend sales data at any moment. Different sales reports include deal forecasting, sales activity, and deal pipeline analysis.
In case you don’t have access to Sales Analytics reporting software or just prefer to do it the old-fashioned way, Excel or Google Sheets pivot tables can be used to create Sales Analytics report. It's all about turning a complicated process into an easily digestible snapshot of your sales health. Visually appealing charts and graphs can do a lot to communicate sales data effectively.
6) Look for Patterns and Trends in Your Data
This is the point in time where the findings can be analysed. This involves referencing the measurable objectives to see how they held up against the metrics tracked with the Sales Analytics software. For example, in the case of a retail business that ran a month-long campaign, you would look for the specific sales by unit for each product.
Then, those figures must be compared to their counterparts in a similar, campaign-free time frame. This comparison will help you conclude which products are most attractive to budget-conscious customers.
7) Implement Your Findings
Businesses use Sales Analytics data to shape their future sales efforts, applying what they've learned to better anticipate customer behaviour. In the retail business campaign example mentioned above, information about how the products fare with reduced pricing can be used to selectively discount and promote products that appeal most to deal-hungry prospects.
8) Track Results and Make Adjustments Over Time
Based on the findings and analysis, informed decisions and adjustments can be made to sales strategies, pricing, product offerings, campaigns, and more. However, the objectives and metrics must be revisited and refined regularly.
It's also important to establish a feedback loop between sales analysis and the team. Regularly communicating the insights gained from the analysis to the sales team is a great way to involve them in the process. Their frontline experience can provide valuable context and help refine the analysis approach.
Want to learn how to design effective sales funnel for converting lead into assured customers? Sign up for our Sales Funnels Training now!
Forecasting and Predictive Analytics With Sales Analytics
Sales Analytics empowers organisations to anticipate sales trends and outcomes. Fueled by predictive models and historical data, this capability can revolutionise decision-making and resource allocation.
1) Predicting Future Sales Trends
Sales Analytics ventures beyond hindsight, and by analysing historical sales data, organisations can:
a) Discern patterns
b) Find and optimise cycles
c) Identify fluctuations hinting at future trends
These insights enable businesses to adjust strategies and respond to emerging opportunities.
2) Forecasting Revenue and Demand
Forecasting sales revenues and demand is one of the most practical applications of Sales Analytics. Businesses can estimate the expected sales figures for upcoming weeks, months, or years. This insight impacts inventory management, production planning, and resource allocation.
3) Leveraging Historical Data for Forecasts
The basis of predictive analytics lies in historical data. By scrutinising past sales performance, businesses can identify seasonality, recurring buying patterns, and the effect of external factors. This historical context helps predictive models paint a fuller picture of the future.
4) Exploring Predictive Models
Advanced algorithms allow predictive models to extract meaning from historical data to create forecasts. These models consider various variables, including:
a) Sales history
b) Market trends
c) Funnel positioning
d) Economic indicators
e) Political situation
f) Weather patterns
Become a master sales professional and elevate your outbound sales performance through our Outbound Sales Training – Sign up now!
Key Features to Look for in Sales Analytics Tools
There's a multitude of Sales Analytics tools available to help you track sales metrics. When choosing a Sales Analytics software solution, there are some specific features you must look for as explained below:
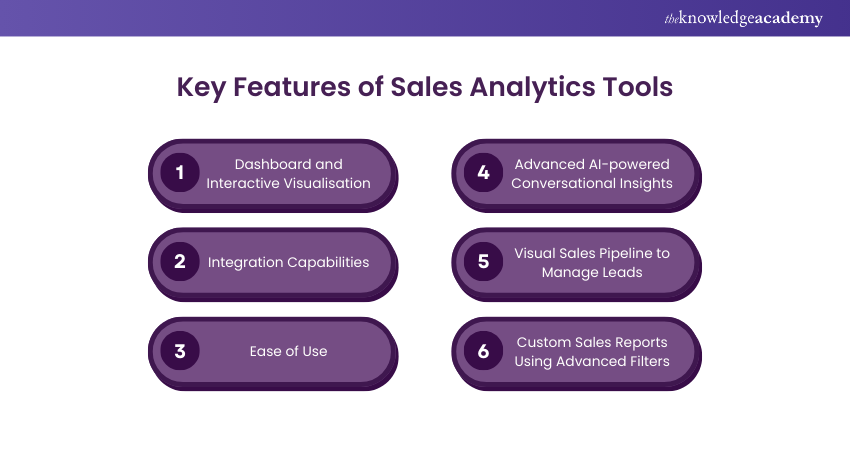
1) Interactive Visualisation: Look for visual dashboards that allow company leaders and sales teams to view sales activities at a glance.
2) Ease of Use: Features such as real-time updates and automatic syncing help save time and keep information current without needed additional steps for your team. Additionally, mobile capabilities are handy since sales teams often meet with customers on the road. That way, they can update customer data without waiting until they are back in the office.
3) Integration Capabilities: Since data comes from various sources, the Sales Analytics solution must work seamlessly alongside the other tools being used. The analytics tools should integrate with existing apps such as email marketing platforms, task management software, and calendars.
Conclusion
In conclusion, Sales Analytics is essential for unlocking powerful insights that drive business success. By harnessing data and the insights it provides, you can enhance your understanding of customers, refine strategies, and boost performance. Having a firm grasp on what is Sale Analytics as explored in this blog will expand your expertise in Sales Analytics tools and techniques respectively.
Master the art of crafting persuasive online content and sales pitches through our detailed Online Sales Training – Register now!
Frequently Asked Questions
How Often Should Sales Data be Analysed?

Generally, you must audit your sales data annually or whenever significant changes are done to your data sources, systems, or processes. However, depending on specific needs and goals, you may want to audit sales data more frequently, such as weekly, quarterly, or monthly.
What are the Most Important Sales Metrics to Track?

The important sales metrics to track include:
a) Total revenue measures
b) Percentage of revenue from new business measures
c) Percentage of revenue from existing customers measures
d) Conversion rate measures
e) Cost of selling
f) Average length of sales cycle
What are the Other Resources and Offers Provided by The Knowledge Academy?

The Knowledge Academy takes global learning to new heights, offering over 30,000 online courses across 490+ locations in 220 countries. This expansive reach ensures accessibility and convenience for learners worldwide.
Alongside our diverse Online Course Catalogue, encompassing 19 major categories, we go the extra mile by providing a plethora of free educational Online Resources like News updates, Blogs, videos, webinars, and interview questions. Tailoring learning experiences further, professionals can maximise value with customisable Course Bundles of TKA.
What is The Knowledge Pass, and How Does it Work?

The Knowledge Academy’s Knowledge Pass, a prepaid voucher, adds another layer of flexibility, allowing course bookings over a 12-month period. Join us on a journey where education knows no bounds.
What are the Related Courses and Blogs Provided by The Knowledge Academy?

The Knowledge Academy offers various Sales Courses, including Sales Negotiation Training and the Value Based Selling Course. These courses cater to different skill levels, providing comprehensive insights into What is Sales Performance Management.
Our Business Skills Blogs cover a range of topics related to sales, offering valuable resources, best practices, and industry insights. Whether you are a beginner or looking to advance your sales skills, The Knowledge Academy's diverse courses and informative blogs have got you covered.
Upcoming Business Skills Resources Batches & Dates
Date
 Sales Bootcamp
Fri 9th May 2025
Fri 11th Jul 2025
Fri 12th Sep 2025
Fri 14th Nov 2025


 Top Rated Course


 If you wish to make any changes to your course, please


