


 Top Rated Course

We may not have the course you’re looking for. If you enquire or give us a call on 01344203999 and speak to our training experts, we may still be able to help with your training requirements.
Spearman's Rank Correlation: A Complete Overview
Sienna Roberts 03 April 2025Interested in understanding Spearman's Rank Correlation? It's a statistical measure that evaluates the strength and direction of the relationship between two ranked variables. This blog will delve into the calculation, interpretation, and applications of Spearman's Rank Correlation in various fields. Let's explore this valuable statistical tool!
Training Outcomes Within Your Budget!
We ensure quality, budget-alignment, and timely delivery by our expert instructors.
![]()
Ever wondered how closely two things are related? Whether it’s the correlation between hours studied and exam scores, or the relationship between ice cream sales and crime rates, understanding the strength of such connections is crucial in various fields. This is where Spearman's Rank Correlation comes into play. Beyond being a statistical term, it's a powerful tool for uncovering hidden patterns in data.
This comprehensive blog will demystify Spearman's Rank Correlation, explaining how it works, its applications, and how to calculate it. From beginners to data enthusiasts, this blog will equip you with the knowledge to confidently analyse relationships between variables using Spearman's Rank Correlation. Let's dive in!
Table of Contents
1) What is a Monotonic Relationship?
2) What is Spearman's Rank Correlation?
3) Compute Spearman's Rank Correlation Stepwise
4) Characteristics of Spearman's Correlation
5) Benefits of Spearman's Rank Correlation
6) Drawbacks of Spearman's Rank Correlation
7) Conclusion
What is a Monotonic Relationship?
A monotonic relationship is a type of relationship between two variables where one variable consistently increases or decreases as the other does, without changing direction. In a monotonic increasing relationship, as one variable increases, the other also increases or stays constant. In a monotonic decreasing relationship, as one variable increases, the other decreases or remains the same.
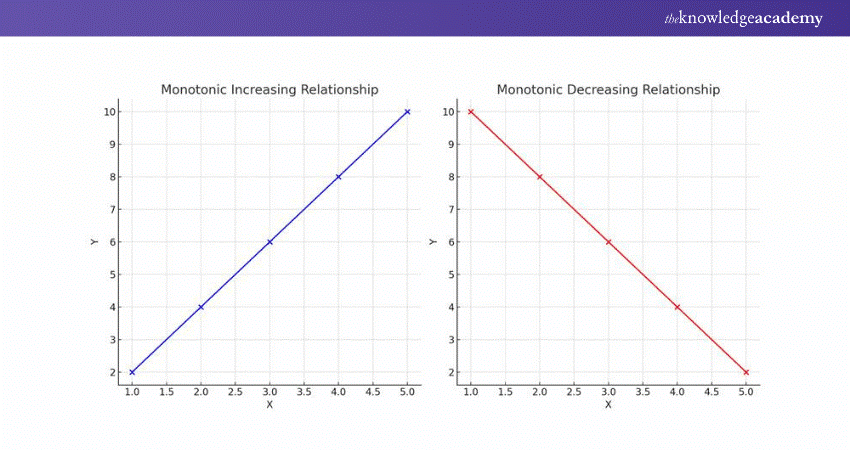
This concept is crucial in statistics and data analysis, helping to identify consistent patterns or trends between variables, even if they aren't strictly linear. Monotonic relationships can be visualised using graphs where the data points do not exhibit fluctuations in direction.

What is Spearman's Rank Correlation?
Building on the concept of monotonic relationships, Spearman's Rank Correlation is a non-parametric measure that assesses the strength and direction of a monotonic relationship between two ranked variables. Unlike Pearson's correlation, which requires the data to be linearly related and normally distributed, Spearman's Rank Correlation uses the ranks of data points, making it suitable for ordinal data or non-linear relationships.
This correlation coefficient, denoted as ρ or rs , ranges from -1 to +1. A value of +1 indicates a perfect positive monotonic relationship, where as one variable's rank increases, so does the other's. Conversely, a value of -1 signifies a perfect negative monotonic relationship, where one variable's rank increases as the other's decreases. A value close to 0 suggests no consistent monotonic relationship.
Spearman's Rank Correlation is widely used in situations where the data do not meet the assumptions required for Pearson's correlation, offering a more flexible approach to understanding relationships between variables.
Compute Spearman's Rank Correlation Stepwise
Spearman's Rank Correlation is a statistical measure used to assess the strength and direction of the monotonic relationship between two ranked variables. It is particularly useful when data are not normally distributed or when the relationship between variables is non-linear. Here's a step-by-step instruction for using a small dataset:
![]()
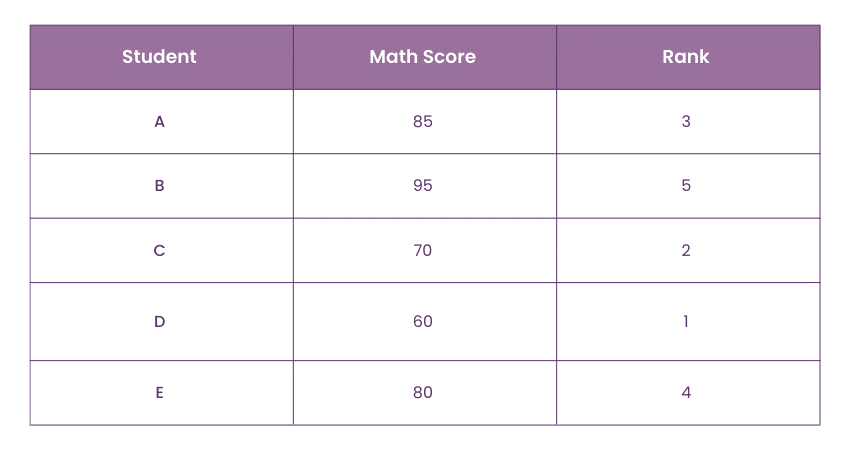
Converting Original Data into Ranks
The first step in computing Spearman's Rank Correlation is to convert the original data into ranks. Each value in a dataset is replaced with its rank within the dataset. If two or more values are the same, they receive the average rank.
Math Scores Ranks:
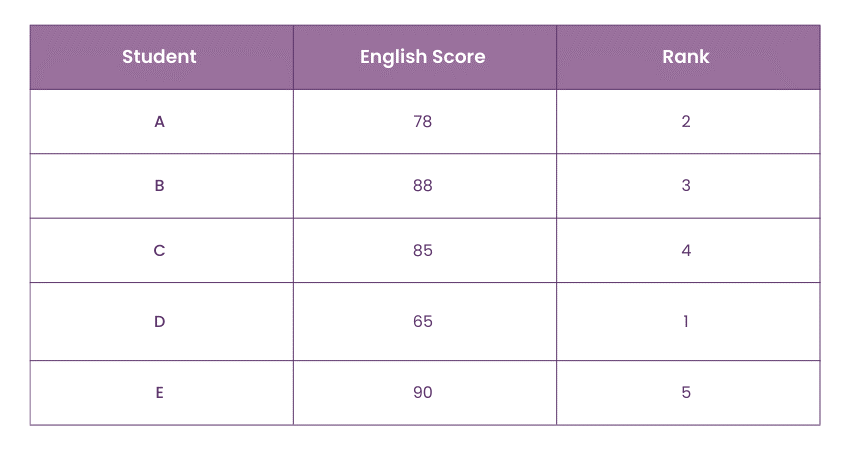
English Scores Ranks:
Calculating Spearman's Correlation
Spearman's Rank Correlation coefficient is calculated using the formula:

where di is the difference between the ranks of each observation in the two variables, and n is the number of observations.
Calculate the Differences (d) and d2:
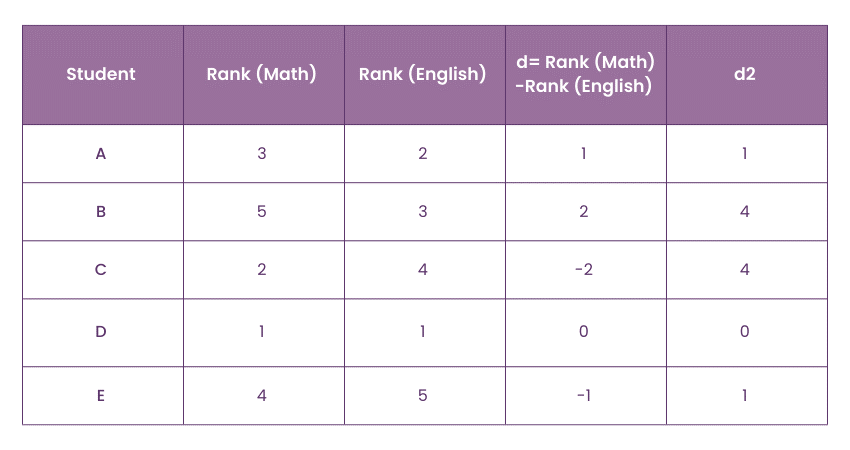
Sum of d2:

Apply the formula:

Spearman's Rank Correlation coefficient ρ is 0.5, indicating a moderate positive monotonic relationship between Math and English scores.
Enhance quality management—Sign up for our Statistical Process Control Training today!
Characteristics of Spearman's Correlation
Spearman's Correlation, denoted as rs, has several important properties that make it a versatile tool in statistical analysis:
1) Range of Values: The Spearman correlation coefficient, rs, ranges between -1 and 1. An rs value of 1 indicates a perfect positive monotonic relationship, where as one variable increases, the other also consistently increases. Conversely, an rs value of -1 signifies a perfect negative monotonic relationship, where one variable increases as the other consistently decreases. These extreme values reflect a perfect monotonic relationship, where ranks are perfectly aligned in either direction.
2) No Association: An rs value of 0 indicates no monotonic association between the variables. This means that changes in one variable do not correspond to consistent changes in the other, either increasing or decreasing. It is important to note that rs =0 does not imply independence; it only suggests the absence of a monotonic relationship.
3) Non-linear Associations: Unlike Pearson's correlation, which measures linear relationships, Spearman's correlation is adept at capturing non-linear associations. It assesses the strength and direction of the monotonic relationship by converting the original data into ranks. This characteristic makes it valuable when the data do not exhibit a linear trend but still show a consistent pattern of increase or decrease, a scenario where techniques like Correlation and Regression Analysis can help identify the underlying relationship more effectively.
4) Applicability to Ordinal Variables: Spearman's correlation is particularly useful for Ordinal Data, where variables are ranked but not necessarily evenly spaced. Since the method relies on ranks rather than the raw data values, it can be applied to any data that can be ordered, including ordinal variables. This flexibility allows researchers to use Spearman's correlation in a wide range of contexts, such as social sciences, where data often come in ordinal form (e.g., satisfaction ratings, survey responses).
Benefits of Spearman's Rank Correlation
Spearman's Rank Correlation is a versatile and robust statistical tool used to assess the strength and direction of the relationship between two ranked variables. Here are some key benefits:
![]()
a) This method is straightforward and easy to comprehend.
b) It excels in evaluating qualitative data, such as intelligence levels or physical appearance.
c) Ideal for situations where data provides only the order of preference, not actual values.
d) Robust to outliers, maintaining accuracy despite anomalies in the data.
e) Specifically designed to capture monotonic relationships, highlighting the consistent directional changes between variables.
Unlock the power of data with our Introduction to Statistics Course. Join now and start your journey towards data-driven decision-making!
Drawbacks of Spearman's Rank Correlation
While Spearman's Rank Correlation is a valuable tool for assessing monotonic relationships between variables, it does have some limitations and drawbacks:
![]()
a) Not suitable for grouped data analysis.
b) Limited to a smaller number of observations or items.
c) Does not account for non-monotonic relationships, missing curvilinear or non-linear associations.
d) Focuses solely on ranks, ignoring the actual magnitude of differences between variables.
e) The conversion to ranks can lead to a loss of detailed information, especially when the original data values are significant or have specific units.
Maximise efficiency and profits—Join our Mathematical Optimisation for Business Problems Course and master the art of optimal decision-making!
Conclusion
Understanding Spearman's Rank Correlation is crucial for uncovering hidden relationships in data. Armed with this knowledge, you can explore correlations in various fields with confidence. From academic research to business analytics, mastering this statistical tool is a valuable asset.
Advance your career—Register for our Business Analyst Courses today and become a data-driven decision-maker.
Frequently Asked Questions
Can Spearman's Rank Correlation be Used With Non-numeric Data?
Yes, Spearman's rank correlation can be used with non-numeric data, as long as the data can be ordered or ranked, such as in ordinal data like ratings or ranks.
Is Spearman's Rank Correlation Affected by Outliers?
Spearman's rank correlation is robust to outliers. Since it uses ranks rather than actual values, outliers have less influence on the correlation coefficient.
In What Fields is Spearman's Rank Correlation Commonly Used?
Spearman's rank correlation is commonly used in social sciences, psychology, and biology, particularly when data do not meet the assumptions of parametric tests or involve ordinal measurements.
What are the Other Resources and Offers Provided by The Knowledge Academy?
The Knowledge Academy takes global learning to new heights, offering over 3,000 online courses across 490+ locations in 190+ countries. This expansive reach ensures accessibility and convenience for learners worldwide.
Alongside our diverse Online Course Catalogue, encompassing 19 major categories, we go the extra mile by providing a plethora of free educational Online Resources like News updates, Blogs, videos, webinars, and interview questions. Tailoring learning experiences further, professionals can maximise value with customisable Course Bundles of TKA.
What is The Knowledge Pass, and How Does it Work?
The Knowledge Academy’s Knowledge Pass, a prepaid voucher, adds another layer of flexibility, allowing course bookings over a 12-month period. Join us on a journey where education knows no bounds.
What are the Related Courses and Blogs Provided by The Knowledge Academy?
The Knowledge Academy offers various Business Analyst Courses, including the Certified Business Analyst Professional (CBA-PRO) Course, Introduction to Statistics Course and the Introduction to Business Analytics Training. These courses cater to different skill levels, providing comprehensive insights into Standard Deviation in Statistics.
Our Business Analysis Blogs cover a range of topics related to Statistics, offering valuable resources, best practices, and industry insights. Whether you are a beginner or looking to advance your Business Analyst skills, The Knowledge Academy's diverse courses and informative blogs have got you covered.
Upcoming Business Analysis Resources Batches & Dates
Date
 Statistics Course
Statistics Course
Fri 25th Apr 2025
Statistics Course
Fri 20th Jun 2025
Statistics Course
Fri 22nd Aug 2025
Statistics Course
Fri 17th Oct 2025
Statistics Course
Fri 19th Dec 2025
 If you wish to make any changes to your course, please


