


 Top Rated Course

We may not have the course you’re looking for. If you enquire or give us a call on 01344203999 and speak to our training experts, we may still be able to help with your training requirements.
What is Standard Deviation in Statistics with Examples
Sienna Roberts 11 February 2025Standard Deviation measures the spread of data around the Mean. It is a useful parameter used by business analysts worldwide. It provides diverse levels of insights into variability and consistency. Read this blog to learn its calculation, purpose, strengths, limitations, and real-world applications across finance, healthcare, etc.
Training Outcomes Within Your Budget!
We ensure quality, budget-alignment, and timely delivery by our expert instructors.
Table of Contents
What is Standard Deviation?
The Purpose of Standard Deviation How to Calculate the Standard Deviation? Use Cases of Standard DeviationStrengths of Standard DeviationWhat is the Difference Between Mean Deviation and Standard Deviation?What is the Difference Between the Mean and the Standard Deviation?Conclusion

Standard Deviation is a fundamental Statistical concept that measures the dataset variations and dispersions. It plays a crucial role in understanding data distribution and making informed decisions in various fields, ranging from finance to science. It basically measures the dispersion of data and quantifies data variability.
In this blog, you understand what Standard Deviation is, exploring its calculation methods, widespread applications, limitations, and more. Let’s dive into this data-driven journey!
Table of Contents
1) What is Standard Deviation?
2) The purpose of Standard Deviation
3) How to Calculate the Standard Deviation?
4) Use Cases of Standard Deviation
5) Strengths of Standard Deviation
6) What is the Difference Between Mean Deviation and Standard Deviation?
7) What is the Difference Between the Mean and the Standard Deviation?
8) Conclusion
What is Standard Deviation?
Standard Deviation is a fundamental statistical measure that provides insight into the variability, dispersion, and distribution of Data Points within a dataset. Technically, Standard Deviation quantifies the degree to which individual Data Points deviate from the central tendency represented by the Mean.
Mathematically, Standard Deviation is calculated by taking the square root of the Variance. Variance measures the average squared difference between each Data Point and the Mean. While, Standard Deviation brings this measure back to the original units of the data, making it more interpretable.
A low Standard Deviation is an indication of the Data Points being close to the Mean, thus having little variability or dispersion.A low Standard Deviation is an indication that the data points are close to the Mean, thus having little variability or dispersion. Conversely, a high Standard Deviation signifies that Data Points are more widely dispersed from the Mean, indicating greater variability in the dataset.
Standard Deviation is widely used in various fields. These include Statistics, finance, science, and social sciences. It helps in risk assessment, quality control, Hypothesis Testing, and data analysis, allowing researchers, analysts, and decision-makers to understand and interpret data distributions better.

The Purpose of Standard Deviation
Standard Deviation serves as a cornerstone in statistical analysis, offering critical insights into the variability and consistency of data. The purpose of Standard Deviation can be summarised as follows:
1) Quantifying Variation: Standard Deviation precisely quantifies the dispersion of data points around the Mean. A high Standard Deviation indicates that data points are spread out over a wider range, while a low Standard Deviation suggests that data points are clustered closely around the mean.
2) Identifying Outliers: Standard Deviation assists in identifying outliers or extreme values in a dataset. Outliers can significantly affect data analysis and decision-making, and Standard Deviation helps flag them.
3) Comparing Datasets: Standard Deviation enables the comparison of variability between different datasets. It allows you to assess which dataset exhibits more or less variability, making it a valuable tool in various domains, including finance, quality control, and scientific research.
Prepare for your next interview! Explore essential stakeholder management interview questions and answers now!
How to Calculate the Standard Deviation?
Standard deviation is automatically computed by the statistical analysis software you employ. However, it can also be manually calculated to comprehend the underlying formula better.
To manually calculate Standard Deviation, you must follow six primary steps. These steps are described below:
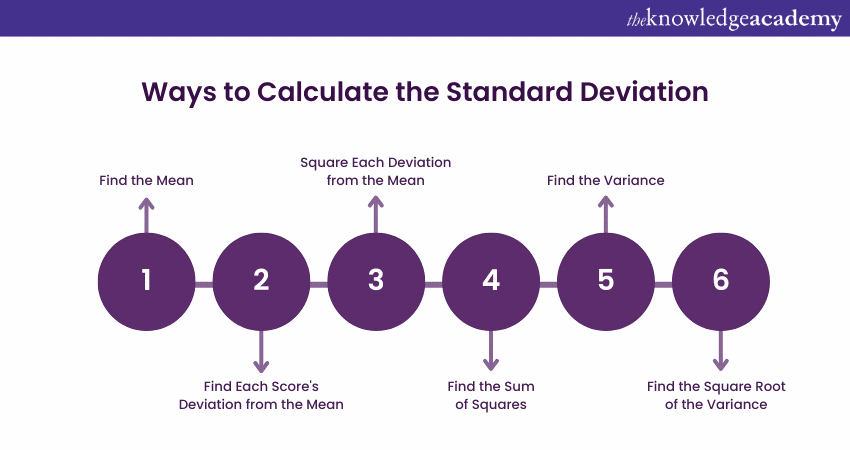
Step 1: Find the mean
To calculate the Mean, you need to sum up all the individual dataset scores and then divide this sum by the total dataset score. This process provides you with a central value that represents the data average or its typical value.
For example, you have a dataset of exam scores for a class of five students: 85, 92, 78, 88, and 95. To find the Mean, you first need to add these scores together: 85 + 92 + 78 + 88 + 95 = 438
Then, divide this total by the number of scores, which comes out to be 5. Therefore, the class Mean (average) score would be 87.6 by dividing 438 by 5. This means that the average class of students scored approximately 87.6 points on their exams.
Step 2: Find Each Score’s Deviation From the Mean
To obtain the Mean deviations, you should first subtract the calculated Mean value from each dataset score. This process helps you understand how each data point differs from the mean or average. This indicates whether a data point is above or below the central tendency.
For example, in the case of the class's exam scores, we found that the Mean score was 87.6. Now, to calculate the deviations from the Mean for each student's score, you would subtract this Mean value from each student's score.
For instance, for the first student with a score of 85, the deviation from the Mean is 85 - 87.6 = -2.6. For the second student with a score of 92, the deviation is 92 - 87.6 = 4.4. You repeat this process for each score in the dataset, which provides insights into how each student's performance compares to the class's overall average.
Build an effective stakeholder management plan! Learn the key steps to keep your project on track.
Step 3: Square Each Deviation From the Mean
For each deviation from the Mean, you should square the value. Squaring these deviations turns them into positive numbers and is an essential step in the calculation of the variance, a measure of the spread or variability within the dataset.
After determining the deviations from the Mean for each student's score, you, then square each of these deviations. For example, for the first student with a deviation of -2.6, squaring results in 6.76 (since -2.6 * -2.6 = 6.76), and for the second student with a deviation of 4.4, squaring results in 19.36 (since 4.4 * 4.4 = 19.36).
By squaring these values, you ensure that they are all positive and give more weight to larger deviations in performing your analysis.
Step 4: Find the Sum of Squares
Summing up all the Squared Deviations, referred to as the "Sum of Squares," is the subsequent step in Variance calculation. The squares sum quantifies the total dataset variability, by taking into account the squared differences between each data point and the Mean.
In our class's exam scores dataset; after squaring the deviations for each student's score, you would add these squared values together. For example, for the first student with a squared deviation of 6.76 and the second student with a squared deviation of 19.36, you would add these two values along with the squared deviations of all other students. This cumulative sum represents the "sum of squares," which measures the overall variation within the dataset.
Discover how stakeholder analysis can improve project success! Dive into our comprehensive guide.
Step 5: Find the variance
To calculate the variance, take the sum of the squared deviations (the "sum of squares") and divide it by the appropriate value. For a sample dataset, divide the sum of squares by n - 1 (where "n" is the sample size), and for a population dataset, divide it by N (the total number of data points in the population).
Step 6: Find the Square Root of the Variance
Once the variance is calculated, the next step is to determine the Standard Deviation. To do this, simply take the Variance’s square root. This process transforms the Variance back into the original data units, making the Standard Deviation easier to interpret and analyse.
Use Cases of Standard Deviation
Standard Deviation is a versatile statistical measure with numerous real-life applications across various fields. It helps understand data variability, assess risk, and make informed decisions. Here are some of the use cases mentioned below:
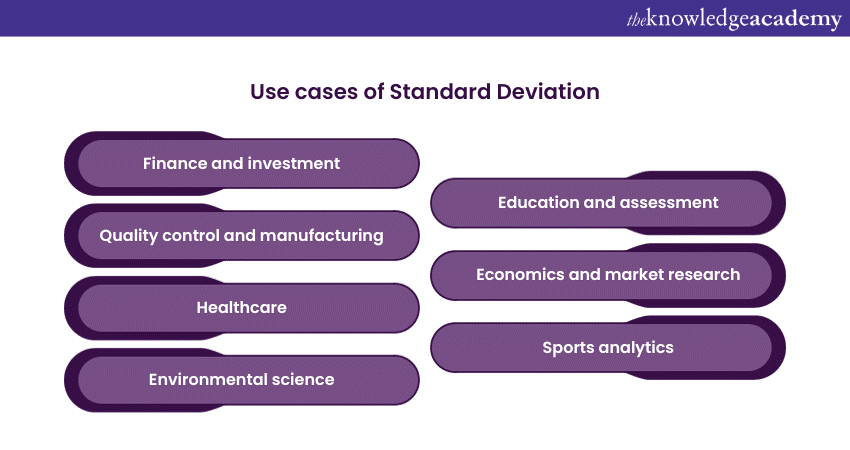
1) Finance and Investment
a) Portfolio Risk Assessment: Investors and financial Analysts use Standard Deviation to measure the investment portfolios volatility. A higher Standard Deviation indicates greater risks. This helps investors to make informed choices about diversification.
b) Stock Price Volatility: Traders and Analysts assess the stock volatility prices using Standard Deviation. It helps in predicting market movements and making decisions related to trading.
2) Quality Control and Manufacturing
a) Product quality: Manufacturers use Standard Deviation to ensure consistent product quality. They can identify and address quality issues by measuring the variability of product dimensions or characteristics.
b) Process control: In industries like semiconductor manufacturing, Standard Deviation helps monitor production processes to maintain tight control over specifications and minimise defects.
3) Healthcare
a) Medical research: Standard Deviation measures the variability in medical data, such as patient responses to treatment or the distribution of medical test results. Researchers use it to draw meaningful conclusions from clinical trials.
b) Healthcare performance metrics: Hospitals and healthcare providers use Standard Deviation to assess patient outcomes and healthcare quality variations. It aids in identifying areas for improvement.
4) Environmental Science
a) Climate data analysis: Environmental scientists use Standard Deviation to analyse climate data. It helps identify trends, extremes, and anomalies in temperature, rainfall, and other variables.
b) Pollution monitoring: Standard Deviation is used to assess the variability of pollutant levels in air and water quality monitoring. It aids in identifying sources of pollution.
Clarify stakeholder roles and responsibilities with our easy-to-follow guide. Get started now!
5) Education and Assessment
a) Test score analysis: Educational institutions and policymakers use Standard Deviation to evaluate student performance on standardised tests. It helps identify gaps in achievements and assess the effectiveness of educational programs.
b) Grading consistency: Teachers and grading committees use Standard Deviation to ensure consistent grading practices. It helps maintain fairness in assessment.
6) Economics and Market Research
a) Economic indicators: Economists use Standard Deviation to analyse economic data, such as inflation rates and GDP growth. It provides insights into economic stability and volatility.
b) Consumer behaviour: Market researchers use Standard Deviation to analyse consumer preferences and behaviours. It helps businesses tailor their products and marketing strategies.
7) Sports Analytics
a) Player performance: Sports analysts use Standard Deviation to evaluate player performance Statistics like scoring averages, assists, or rebounds. It helps teams make data-driven decisions like player recruitment or strategy adjustments.
b) Team performance: Standard Deviation is used to assess the variability of team performance in various sports. It aids in ranking teams and predicting tournament outcomes.
Unlock your potential in the world of business analysis with our Business Analyst Fundamentals Course. Register today!
Strengths of Standard Deviation
Standard Deviation, often denoted as σ (sigma) for population data and s for sample data, is a powerful statistical tool with several strengths that make it invaluable in data analysis and decision-making. Let's explore some of its key strengths:
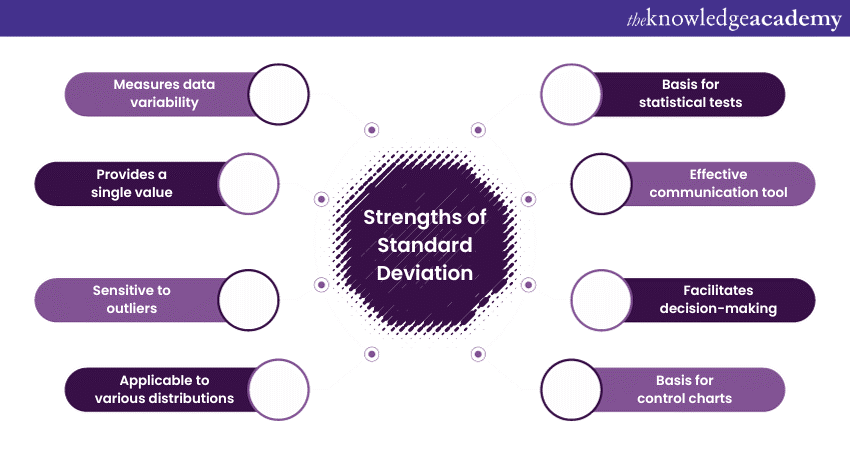
a) Measures Data Variability: Standard Deviation quantifies the spread or dispersion of Data Points within a dataset. It clearly indicates how individual Data Points deviate from the Mean. A high Standard Deviation suggests that Data Points are widely scattered, while a low Standard Deviation indicates that Data Points are closely clustered around the Mean.
b) Provides a Single Value: Standard Deviation condenses the information about data variability into a single numerical value. This simplifies data interpretation and allows for easy comparison between datasets. For example, it helps compare the risk associated with different investment portfolios in finance.
c) Sensitive to Outliers: Standard Deviation is sensitive to outliers, which are extreme values that can significantly impact data distribution. This sensitivity helps in identifying and addressing anomalies in the dataset. It's particularly valuable in quality control processes to detect defective products in manufacturing.
d) Applicable to Various Distributions: Standard Deviation is not limited to specific data distributions. It can be used with multiple types of data, including normal (bell-shaped), skewed, and multimodal distributions. This versatility makes it a widely applicable tool in numerous fields, including microeconomics, biology, economics, and social sciences.
e) Basis for Statistical Tests: Standard Deviation serves as the foundation for many statistical tests, such as hypothesis testing and ANalysis of VAriance (ANOVA). These tests rely on the square of the Standard Deviation or variance.
f) Effective Communication Tool: Standard Deviation facilitates effective communication of data characteristics. When presenting findings or making decisions, expressing data variability through Standard Deviation helps stakeholders grasp the uncertainty or risk associated with the data.
g) Facilitates Decision-making: In fields like finance, where risk assessment is paramount, Standard Deviation is instrumental in making informed decisions. For instance, investors use it to assess the volatility of financial assets and evaluate potential investments.
h) Basis for Control Charts: In quality control and process monitoring, control charts are essential tools. Standard Deviation forms the basis for control limits on these charts, helping organisations detect process variations and maintain consistent quality.
Curious about business analyst salaries? Find out the latest data and trends in your region now!
What is the Difference Between Mean Deviation and Standard Deviation?
Mean deviation and standard deviation both measures how spread-out data is in a dataset. Mean deviation, also known as average deviation, calculates the average distance of each data point from the Mean or median, focusing on absolute differences. This makes it easy to understand and interpret, especially for smaller datasets.
Standard deviation, however, measures variability by taking the square root of the average of the squared deviations from the Mean. This squaring process makes it more sensitive to larger variations, giving more weight to extreme values.
As a result, the Standard Deviation is a more precise measure and is widely used in research and finance for its accuracy. While Mean deviation is simpler, standard deviation provides a more detailed analysis.
What is the Difference Between the Mean and the Standard Deviation?
The Mean and standard deviation are two important concepts in statistics that describe different aspects of a data set. The Mean is the average of all the values in a data set. It is calculated by adding up all the values and dividing the total by the number of values. The Mean provides a single number that represents the centre or "average" value, helping to understand the general trend of the data.
On the other hand, the Standard Deviation measures how spread out the values are around the Mean. A low standard deviation indicates that the values are close to the Mean, while a high standard deviation Means the values are more spread out. It helps to understand the variability or consistency of the data.
Together, the Mean and standard deviation give a clear picture of both the central value and the overall distribution of the data.
Become an IS project management pro with our BCS Foundation Certificate in IS Project Management- Join now!
Conclusion
Standard Deviation is more than just a statistical term—it's a key to unlocking insights from data. You've taken a significant step towards becoming a data-savvy individual by comprehensively exploring its definition, calculation methods, and applications. Irrespective of your use case and domain, Standard Deviation is your trusted companion in Statistics and data analysis.
Learn the roles and responsibilities of a Business Analyst with our Certified Business Analyst Professional (CBA – PRO)
Frequently Asked Questions
What is the Relationship Between Standard Deviation and Normal Distribution?
In a normal distribution, the Standard Deviation measures data that is spread around the Mean. Approximately 68% of values lie within one Standard Deviation, 95% within two, and 99.7% within three. A smaller Standard Deviation Means data is tightly clustered, while a larger one indicates greater spread.
Can Standard Deviation be Negative?
No, the standard deviation cannot be negative. It measures the spread of data around the Mean and is calculated as the square root of Variance, which is always non-negative. A Standard Deviation of zero Means no variation, with all data points being identical.
What are the Other Resources and Offers Provided by The Knowledge Academy?
The Knowledge Academy takes global learning to new heights, offering over 3,000 online courses across 490+ locations in 190+ countries. This expansive reach ensures accessibility and convenience for learners worldwide.
Alongside our diverse Online Course Catalogue, encompassing 19 major categories, we go the extra mile by providing a plethora of free educational Online Resources like News updates, Blogs, videos, webinars, and interview questions. Tailoring learning experiences further, professionals can maximise value with customisable Course Bundles of TKA.
What is The Knowledge Pass, and How Does it Work?
The Knowledge Academy’s Knowledge Pass, a prepaid voucher, adds another layer of flexibility, allowing course bookings over a 12-month period. Join us on a journey where education knows no bounds.
What are the Related Courses and Blogs Provided by The Knowledge Academy?
The Knowledge Academy offers various Business Analyst Course, including Business Analyst Fundamentals Training and Certified Business Analyst Professional (CBA-PRO). These courses cater to different skill levels, providing comprehensive insights into Net Present Value vs Internal Rate of Return.
Our Business Analysis Blogs covers a range of topics related to PRINCE2, offering valuable resources, best practices, and industry insights. Whether you are a beginner or looking to advance your Project Management skills, The Knowledge Academy's diverse courses and informative blogs have you covered.
Upcoming Business Analysis Resources Batches & Dates
Date
 BCS Certificate in Business Analysis Practice
BCS Certificate in Business Analysis Practice
Mon 12th May 2025
BCS Certificate in Business Analysis Practice
Mon 9th Jun 2025
BCS Certificate in Business Analysis Practice
Mon 7th Jul 2025
BCS Certificate in Business Analysis Practice
Mon 4th Aug 2025
BCS Certificate in Business Analysis Practice
Mon 1st Sep 2025
BCS Certificate in Business Analysis Practice
Mon 6th Oct 2025
BCS Certificate in Business Analysis Practice
Mon 20th Oct 2025
BCS Certificate in Business Analysis Practice
Mon 3rd Nov 2025
BCS Certificate in Business Analysis Practice
Mon 17th Nov 2025
BCS Certificate in Business Analysis Practice
Mon 1st Dec 2025
BCS Certificate in Business Analysis Practice
Mon 15th Dec 2025
 If you wish to make any changes to your course, please


