We may not have the course you’re looking for. If you enquire or give us a call on 01344203999 and speak to our training experts, we may still be able to help with your training requirements.
Training Outcomes Within Your Budget!
We ensure quality, budget-alignment, and timely delivery by our expert instructors.

Imagine a manufacturing line where every product meets the highest quality standards, with minimal defects and maximum efficiency. How is this level of precision achieved? The answer lies in Statistical Process Control (SPC). This proactive approach ensures consistent quality and enhances overall productivity.
By utilising statistical methods to monitor and control production processes, Statistical Process Control helps manufacturers detect variations and implement corrective actions in real-time. In this blog, we will delve into its principles and explore how it can revolutionise quality management in manufacturing. Let's uncover its power and impact on the industry!
Table of Contents
1) What is Statistical Process Control (SPC)?
2) Types of Process Variations
3) Steps to Implement SPC Charts
4) How to Use Statistical Process Control Effectively?
5) Statistical Process Control Tools
6) Benefits of Statistical Process Control
7) Drawbacks of Statistical Process Control
8) Conclusion
What is Statistical Process Control (SPC)?
Statistical Process Control (SPC) denotes the application of statistical techniques for production methods or process control. It's a swift strategy for supporting ongoing improvement. When regularly monitored, managers can ensure a process that operates at peak potential and produces consistent, high-quality manufacturing.
SPC reduces rework, waste scrap, and quality excursions in a production facility. It involves collecting and analysing data about a process, checking for unexpected data variations and correcting any issues.
Types of Process Variations
In SPC, producers measure the consistency of a process in creating a product with proper characteristics and dimensions. They choose an aspect of the product, such as length, collect data on a subset of products and then plot the data onto a control chart, which calculates its average value and control limits. A process can have two kinds of variations, as detailed below:
1) Special Cause Variation
This results from a specific external event, such as an operator error or a machine malfunction. These variations are unpredictable and indicate a point of instability in a process. When a control chart shows special cause variance, a process measure is out of control. Producers can conduct SPC through control chart analysis, identifying special cause variations and removing them to ensure their production processes are efficient and repeatable.
2) Common Cause Variation
Random variations are inherent in all processes. A common cause variation is predictable and part of a process's normal stability. It indicates process potential or how effectively it can function when eliminating special cause variation.
Struggling to understand efficiency gaps in business processes? Sign up for our Business Process Mapping Training now!
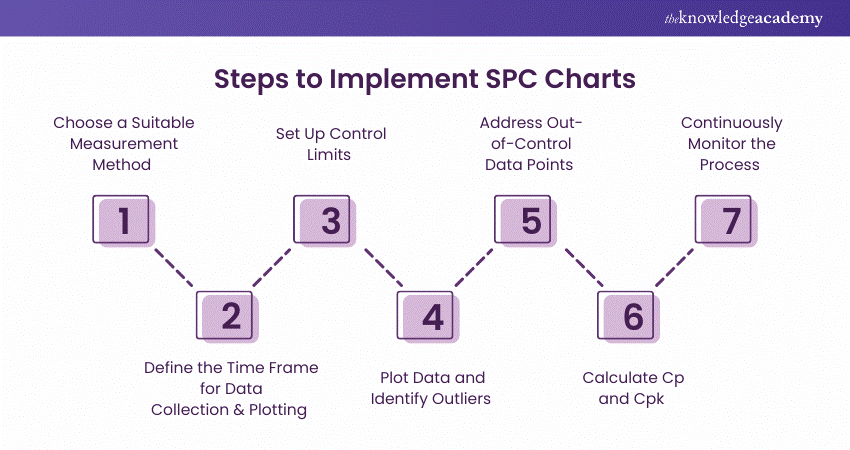
Steps to Implement SPC Charts
SPC charts are used to study changes in the process over time. All the process data are plotted in time order. The main components of an SPC chart are:
1) Central Line (CL) for the average
2) Lower Control Line (LCL) for the lower control unit
3) Upper Control Line (UCL) for the upper control unit
Below, you will find the step-by-step process for constructing an effective SPC chart:

Step 1: Choose a Suitable Measurement Method
The first step involves deciding the data type to collect - variable or attribute. It's highly advisable to use variable data wherever possible as it delivers a higher quality of information. Once the data type is decided on, you can select the appropriate control chart for your data.
Step 2: Define the Time Frame for Data Collection and Plotting
Since SPC charts measure changes in data over time, you must maintain a frequency and period for collecting and plotting it. For instance, making an SPC chart every day or every alternate week can help you see whether your process is reliable or whether you'll be able to meet quality standards in time.
Step 3: Set Up Control Limits
The next step involves establishing the control units. Here's how you can calculate them:
a) Calculate the standard deviation (σ) of sample data
b) To calculate UCL,
UCL = average + 3 x σ
c) To calculate LCL,
LCL = average - 3 x σ
Step 4: Plot Data and Identify Outliers
After setting control limits, it's time to plot the data points on the SPC chart. Once they are plotted, you will see patterns in them. Recognising these patterns is the key to finding the root cause of special causes.
Step 5: Address Out-of-Control Data Points
Whenever data points are found outside the control limits, they must be marked on the chart, and the cause must be investigated. Additionally, you must document what was investigated, the cause that resulted in it being out of control, and the necessary steps to control it. A corrective action matrix can be used to identify responsibilities and establish target dates to track the actions taken.
Step 6: Calculate Cp and Cpk
This step involves determining whether the process can meet specifications by calculating Cp (capability) and Cpk (performance).
Cp is calculated as follows:

Cpk is calculated as follows:

Where
a) X = process average
b) LSL = Lower Specification Limit
c) USL = Upper Specification Limit
d) σest = Process Standard Deviation
Step 7: Continuously Monitor the Process
The final step is continually monitoring the process and updating the SPC chart. Regular monitoring can provide proactive rather than reactive responses when it may be too late or costly.
How to Use Statistical Process Control Effectively?
The effective use of SCP involves considering the following:
1) The first step is evaluating where the manufacturing business faces waste or performance issues. These could be related to wasting entire product ranges, reworking products, or long inspection times.
2) Depending on the need, SPC doesn’t always relate to time, expense, or production delays. During implementation, a cross-functional team will identify the critical aspects of the design or the process that need addressing.
3) This identification is done during a Design Failure Mode and Effects Analysis (DFMEA) exercise. Its data is collected and monitored for critical characteristics.
Statistical Process Control Tools
In total, 14 quality control tools are utilised in Statistical Process Control, divided into seven primary quality control tools and seven supplemental tools. Let's explore them in detail below:
1) Primary Quality Control Tools
The tools under this category are:
a) Cause-and-effect Diagrams: Also known as the fishbone diagram, these diagrams identify numerous causes of any problem. The diagrams look like a fishbone, stretching each bone into smaller branches that delve deeper into each cause.
b) Check Sheets: These are simple, ready-to-use forms for collecting and analysing data. They are especially useful for data that is repeatedly observed and collected by the same person or in the same location.
c) Histograms: Histograms resemble bar charts and are graphs that showcase frequency distributions, making them ideal for numbered data.
d) Pareto Charts: These are bar graphs representing frequency and cost. They are particularly useful in measuring problem frequency and showcase the 80/20 Pareto principle: addressing 20% of the processes will resolve 80% of the problems.
e) Scatter Diagrams: Also called an X-Y graph, scatter diagrams ideally work best when paired with numerical data.
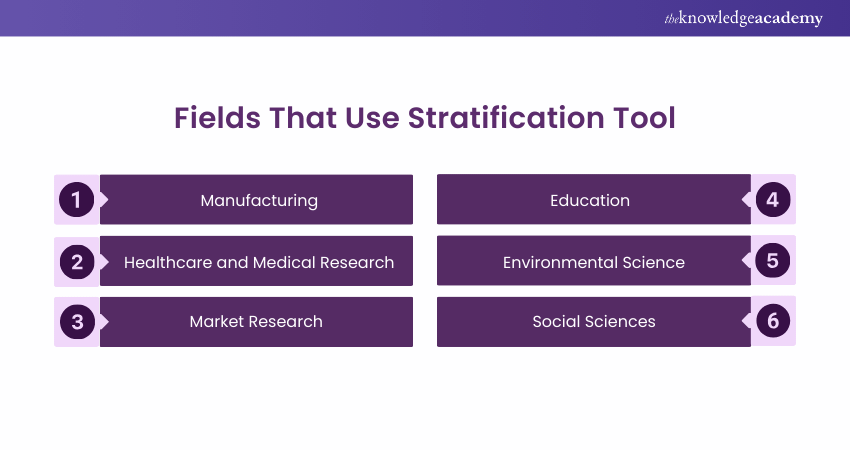
f) Stratification: It's a tool for separating data that simplifies pattern identification. It sorts people, objects, and related data into specific groups or layers. It's perfect for data from diverse sources.

g) Control Charts: These are among the most popular and oldest statistical process tools.
Master the core principles of Business Analysis methodologies in our Certified Business Analyst Professional (CBA-PRO) Course - Register now!
2) Additional Supplemental Tools
Here are some supplemental tools that help in Statistical Process Control:
a) Defect Maps: These maps visualise and track a product’s defects, focusing on flaws and physical locations. Each defect is identified on the map.
b) Events Logs: These standardised records document key software and hardware events.
c) Process Flowcharts: These form a snapshot of the steps in a process, showcased in the order they occur.
d) Progress Centers: Progress centres are centralised locations, allowing businesses to monitor progress and collect data.
e) Randomisation: Randomisation involves using chance to assign manufacturing units to a treatment group.
f) Sample Size Determination: This tool determines the number of events or individuals needed to be included in the statistical analysis.
Benefits of Statistical Process Control
There are various benefits of SPC, as it:
a) Minimises waste and rework
b) Provides facts to catalyse decision-making
c) Boosts productivity
d) Improves product quality
e) Aligns process capabilities with product needs
f) Maintains control through constant process monitoring
g) Makes the procedure more efficient
h) Increases product dependability
Drawbacks of Statistical Process Control
Despite its numerous benefits, there are some significant drawbacks of Statistical Process Control to watch out for:
1) Time Requirements: While Statistical Process Control emphasises early detection, implementing the system in a manufacturing setup can take a long time. Monitoring and filling out charts can also be time-consuming.
2) Cost Considerations: SCP is expensive. It requires companies to sign contracts with service providers and invest in training resources and materials.
3) Quality Measurements: While Statistical Process Control detects non-conformance in the process protocol, it doesn't say how many products may have been defective until that point.
Conclusion
In conclusion, Statistical Process Control is an invaluable ally to anyone aiming for manufacturing excellence. The power of data and statistical analysis can help organisations substantially improve quality and streamline processes. SPC fosters a culture of continuous improvement, ensuring sustained success in your manufacturing processes.
Fulfil your dream of becoming a proficient Business Analyst through our comprehensive Business Analyst Course - sign up now!
Frequently Asked Questions

DMAIC is a data-driven methodology used to improve business processes. It stands for Define, Measure, Analyse, Improve, and Control.

Developed by engineer Bill Smith at Motorola in 1986, Six Sigma is a data-driven methodology to improve business processes by reducing variability and defects.

The Knowledge Academy takes global learning to new heights, offering over 30,000 online courses across 490+ locations in 220 countries. This expansive reach ensures accessibility and convenience for learners worldwide.
Alongside our diverse Online Course Catalogue, encompassing 19 major categories, we go the extra mile by providing a plethora of free educational Online Resources like News updates, Blogs, videos, webinars, and interview questions. Tailoring learning experiences further, professionals can maximise value with customisable Course Bundles of TKA.

The Knowledge Academy’s Knowledge Pass, a prepaid voucher, adds another layer of flexibility, allowing course bookings over a 12-month period. Join us on a journey where education knows no bounds.

The Knowledge Academy offers various Business Analyst Courses, including the Certified Business Analyst Professional (CBA-PRO) Course and the Business Process Mapping Training. These courses cater to different skill levels, providing comprehensive insights into What is Business Process Analysis.
Our Business Analysis Blogs cover a range of topics related to Statistical Process Control, offering valuable resources, best practices, and industry insights. Whether you are a beginner or looking to advance your Business Analysis skills, The Knowledge Academy's diverse courses and informative blogs have got you covered.
Upcoming Business Analysis Resources Batches & Dates
Date
 Statistical Process Control Training
Fri 21st Feb 2025
Fri 25th Apr 2025
Fri 20th Jun 2025
Fri 22nd Aug 2025
Fri 17th Oct 2025
Fri 19th Dec 2025


 Top Rated Course


 If you wish to make any changes to your course, please


