We may not have the course you’re looking for. If you enquire or give us a call on 01344203999 and speak to our training experts, we may still be able to help with your training requirements.
Training Outcomes Within Your Budget!
We ensure quality, budget-alignment, and timely delivery by our expert instructors.
- Quick Powerful Graphics with Power View, PowerPivot, Power Query, Power Map and Power BI M55164
- Microsoft Power BI for End Users 55400AC
- Retired : Designing and Implementing Enterprise-Scale Analytics Solutions Using Microsoft Azure and Microsoft Power BI DP500
- Microsoft Power BI Data Analyst PL300
- Microsoft BI Training

Are you looking to make your Power BI reports more dynamic and interactive? Field Parameters in Power BI could be your answer. This feature allows users to control visuals and calculations directly within the reports. In this blog, we'll cover what Field Parameters are, how to set them up and provide practical examples of using them to filter, sort, and group data.
By the end of this blog, you'll know how to use Field Parameters to enhance user engagement and make your reports more intuitive, regardless of your skill level in Power BI. Join us to elevate your Data Analysis with Field Parameters, learning both creation and customisation techniques.
Table of Contents
1) What are Field Parameters in Power BI?
2) Need for Field Parameters
3) How to use Field Parameters?
4) Why use Parameters in Power BI?
5) What are the best practices for using Parameters in Power BI?
6) Field Parameters example with use cases
7) Limitations of Field Parameters
8) Conclusion
What are Field Parameters in Power BI?
Power BI Field Parameters are used to enable end-users to make changes to a report or visualisation by selecting different options. It allows the user to change the values in a report without having to modify the underlying data or the report structure. This feature is essentially a set of input controls that can be used to filter, sort, group, or aggregate data based on different user-defined criteria.
The Parameters can be applied to a wide range of visualisations, including charts, tables, and graphs. It can also be used to customise the data displayed on the screen. Examples of Power BI Field Parameters include dropdown menus, sliders, text boxes, and checkboxes. These controls can be configured to allow individuals to select different values, enter specific values, or choose from a list of predefined options.
By allowing users to interact with a report through Field Parameters, Power BI makes it possible to create highly dynamic and interactive reports aligning to the needs of different users or scenarios. This feature is greatly useful for Business Intelligence (BI) and Data Analysis applications, where individuals need to explore and manipulate data in real-time.
Need for Field Parameters
Power BI Field Parameters enable users to dynamically control certain aspects of their report visuals and Data Analysis. They are essential because they provide flexibility and interactivity to the report. It enables users to perform customised analysis and make informed decisions based on their needs.
In Power BI, Field Parameters are essentially placeholders for values that users can change. They are defined in the query editor or by using DAX formulas in the data model. Once defined, Field Parameters can be used in various parts of the report, such as filters, measures, or visuals.
Field Parameters can be used to filter data based on certain conditions, like date ranges or categories, or to perform calculations using different values. They can also be used to customise visuals, such as charts and tables. This allow users to change the way data is presented and analysed. Field Parameters are an essential feature in Power BI as they empower users to create powerful and interactive reports that are tailored to their specific needs and goals.
How to use Field Parameters?
In Power BI, Field Parameters are used to enable users to control the behaviour of a report or visualisation by dynamically changing the values of certain fields. You can use this in scenarios where you want to give users more control over the data being displayed or when you want to create more interactive and personalised reports. Here is a step-by-step guide to using Power BI Field Parameters:
STEP 1: Open the report or visualisation to which you want to add the Parameter to.
First, open the Power BI report or visualisation where you want to use the Parameter. After that, click on the “File” menu and select “Open”. You can choose one of your recent reports or select “Browse other reports”. Make sure that you enable the Field Parameter feature from the preview option.

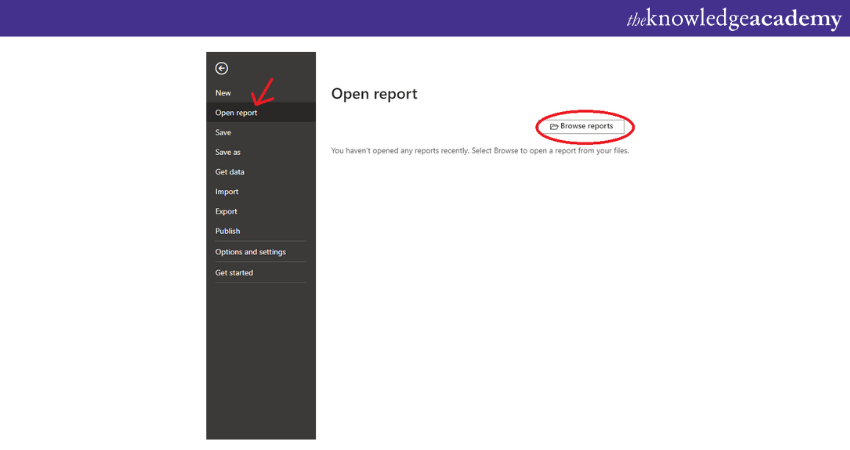
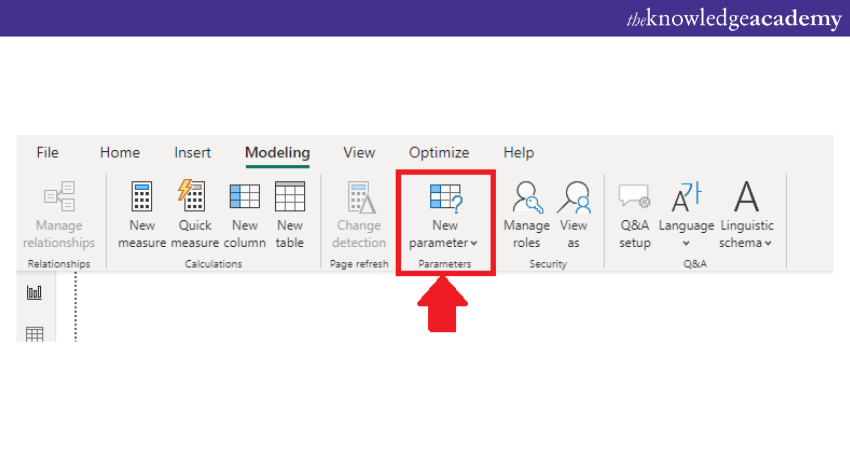
STEP 2: Choose and select a new Field Parameter
After enabling the Field Parameter feature, select a new Parameter. Proceed to the Modelling tab, under which you click on “New Parameter”. Additionally, you must select “Fields” to be directed to the Parameters pop-up window.
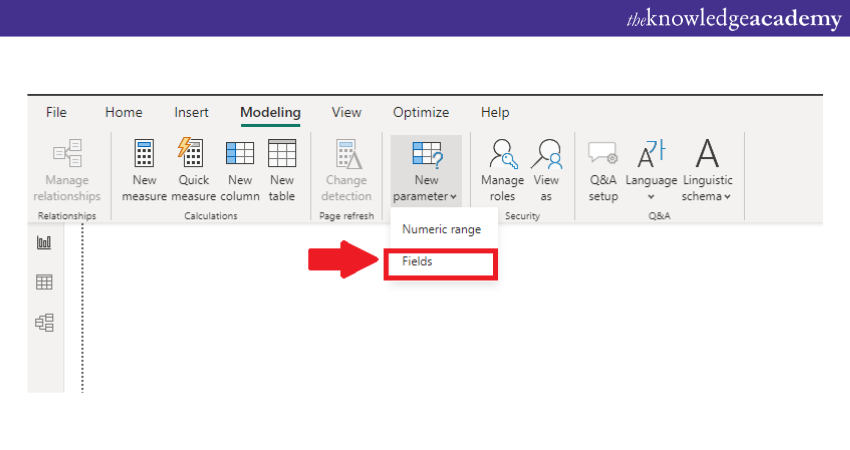
STEP 3: After selecting the “New Parameters” option, you will get two options: “Numeric Range” and “Fields”. Click on the “Fields” option.
STEP 4: There will be an open dialogue box where you can provide a name for your Parameter.
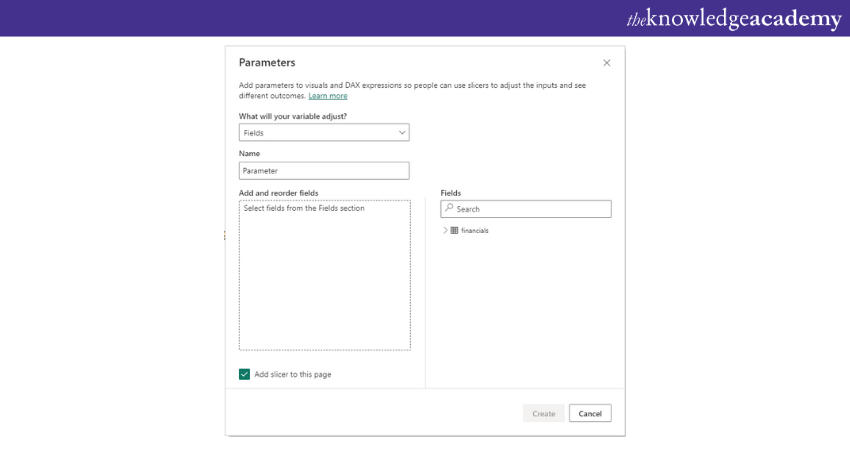
STEP 5: In the above dialogue box, click on the “Fields” option in the right corner. The “Financials” table will appear. Expand the “Financials” options to select from a range of other options.

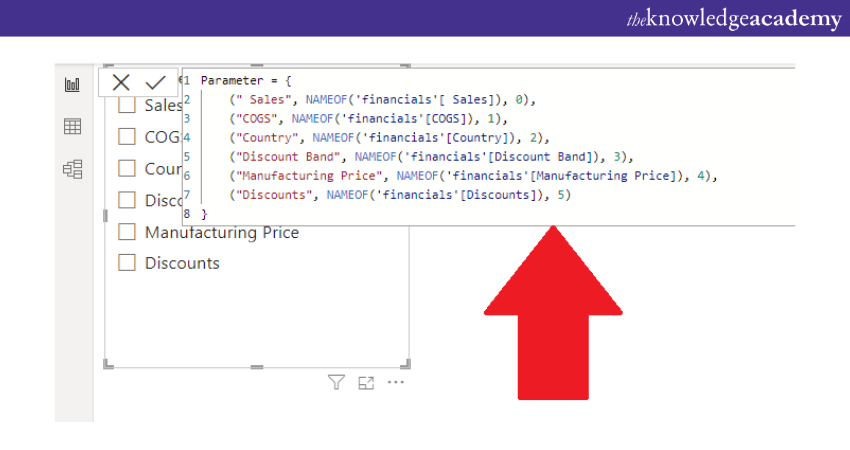
STEP 6: In the image given below, you can see a new “Product Parameter” with a formula that has been created using Power BI. The slicer values give the display names with a NAMEOF function, which is associated with the numbers at the end of each line of the formula. The order of the slicer values can easily be modified. Additionally, you can also make changes in the display name of your slicer values by adjusting the text mentioned in the quotation marks at the initials of each formula.
STEP 7: Add a clustered column chart from the visualisation pane to the canvas.

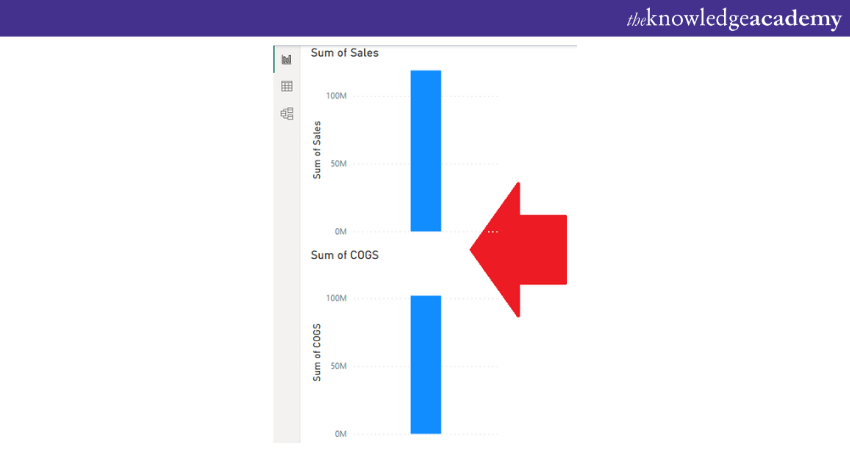
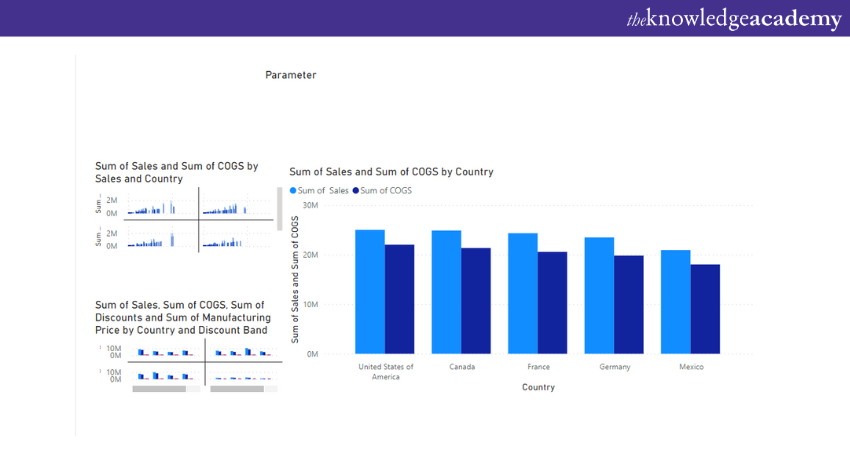
STEP 8: Drag the data to populate your visual and build your visual by selecting a stacked bar chart. The Y-axis and X-axis value with the sum of sales, cost, manufacturing price, and discount band. It gives the actual sum of values with the help of the stacked bar chart.

STEP 9: Select the options segment by segment. Then, the output will be generated in the form of a stacked bar chart. Follow the image below:
Why use Parameters in Power BI?
Parameters in Power BI provide increased flexibility and control, enhancing Data Analysis significantly. They allow for dynamic filtering, personalised reports, and consistent Data Analysis, which are critical for efficient data handling.
1) Dynamic Filtering: This is introduced in 2019 andsers to interactively adjust data visibility based on their needs. This feature simplifies data exploration and enhances real-time analysis, enabling users to apply filters directly within their reports for more focused insights and better decision-making.
2) Customised Reports: Parameters enable the customisation of reports to suit specific user needs. You can define the objectives of your report, select relevant data, and use Power BI’s extensive visualisation tools to tailor your presentation. Adding interactivity with filters and slicers makes the reports more user-friendly and relevant to diverse audiences.
3) Consistent Data Analysis: Maintaining consistency in Data Analysis ensures accuracy and reliability. Standardising data sources, establishing clear data relationships, and applying uniform calculated fields and formatting across reports help achieve a consistent analytical approach. Regular updates to data sources and relationships are recommended to maintain this consistency.
By incorporating Parameters, Power BI users can transform their approach to data analysis, making it more dynamic, personalised, and consistent.
What are the best practices for using Parameters in Power BI?
Using Parameters in Power BI can significantly enhance your reporting experience by allowing for more dynamic and customisable reports. Here are four best practices to ensure you get the most out of Parameters in Power BI:
1) Use descriptive names: It's important to choose clear and descriptive names for your Parameters. This helps in understanding the purpose of each Parameter and ensures ease of use. Avoid vague names to prevent confusion and misinterpretation.
2) Limit the number of Parameters: Simplify your Power BI reports by minimising the number of Parameters. This not only makes your reports easier to manage but also improves user interaction. Consider merging similar Parameters and using default values or dynamic calculations to reduce dependency and complexity.
3) Keep Parameters consistent across reports: Consistency is key. Make sure to use standardised names, values, and formatting for Parameters across all your reports. This standardisation helps in maintaining a uniform approach, making your reports easier to understand and maintain.
4) Test and validate Parameters before publishing: Before going live with your reports, thoroughly test and validate all Parameters. Set up a separate testing environment, use sample data to cover all possible scenarios, and ensure that the Parameters function as expected. Document the testing process and make necessary adjustments to address any issues found.
By following these practices, you can effectively use Parameters to create efficient, reliable, and user-friendly reports in Power BI.
Field Parameters Example with use cases
In Power BI, Field Parameters are used to allow users to filter data interactively in a report or dashboard. The following are some examples of Field Parameters in Power BI with their use cases:
a) Date range Parameter: This Parameter allows users to choose a range of dates to filter data based on a specific time frame. For example, a sales report might allow users to filter data by a particular date range to analyse sales performance during that period.
b) Numeric Parameter: This Parameter lets users choose a specific value or range of values to filter data based on a numeric field. For example, a report might allow users to filter data based on product price or quantity sold.
c) Text Parameter: This Parameter allows individuals to enter specific text to filter data based on a text field. For example, a report might allow users to search for a specific product or customer name.
d) Boolean Parameter: This Parameter lets users to filter data based on a Boolean field, which has two possible values: true or false. For example, a report might allow users to filter data based on whether a product is currently in stock or not.
e) Dropdown Parameter: This Parameter allows individuals to choose a value from a predefined list of options to filter data based on a specific field. For example, a report might allow users to filter data based on product category or region.
Master the best of Business Intelligence reporting with our DAX Training today!
Limitations of Field Parameters
The "Field Parameters" feature in Power BI allows users to add Parameters to a report or a visual, making it possible to create more dynamic and interactive reports. However, there are some limitations to this feature that users should be aware of:
The "Field Parameters" feature in Power BI allows users to add Parameters to a report or a visual, making it possible to create more dynamic and interactive reports. However, there are some limitations to this feature that users should be aware of:
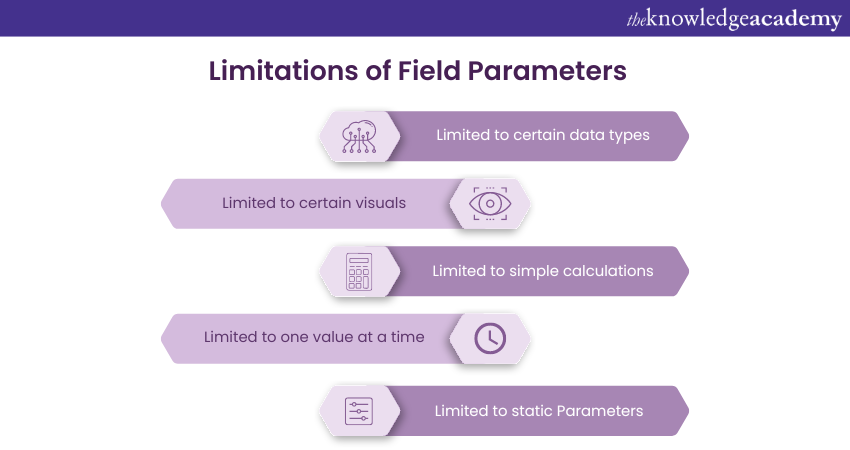
a) Limited to certain data types: Field Parameters can only be applied to certain data types, such as numbers, dates, and text. This means that if the data type of a Field is not compatible with the Field Parameter feature, it cannot be used.
b) Limited to certain visuals: Field Parameters can only be used with certain visuals in Power BI, such as charts and tables. This means that some visuals, such as maps or gauges, cannot use Field Parameters.
c) Limited to simple calculations: Field Parameters can only perform simple calculations, such as addition, subtraction, multiplication, and division. More complex calculations require the use of DAX formulas.
d) Limited to one value at a time: Field Parameters can only apply one value at a time, meaning that it is not possible to select multiple values or apply a range of values.
e) Limited to static Parameters: Field Parameters are static, meaning that they cannot be changed dynamically based on user interactions. For example, if a report has a Parameter for a specific date range, the user cannot change the date range dynamically by clicking on a chart or table
Conclusion
Field Parameters provide a flexible way for users to filter and analyse data in Power BI dashboards. This makes it easier to identify trends, patterns, and insights. With the right types of features, you can explore a range of opportunities to make your reports more efficient, easy to understand, and visually appealing. This blog has covered everything you need to know about using Field Parameters in Power BI.
Learn the skills required to become a certified Power BI professional. Sign up for our Microsoft Power BI Training & Certification Course. Sign up for our right away!
Frequently Asked Questions

The Fields section in Power BI is where data elements from loaded datasets are displayed. Users can drag these fields onto their reports to create visualisations, define relationships, or modify data models, making it a central component for report development and data exploration.

Field Parameters in Power BI allow users to change the data fields in visualisations, offering flexibility in report interactions. Calculation groups, on the other hand, let users apply multiple calculations across different measures in one go, enhancing analytical depth without cluttering the report with numerous similar measures.

The Knowledge Academy’s Knowledge Pass, a prepaid voucher, adds another layer of flexibility, allowing course bookings over a 12-month period. Join us on a journey where education knows no bounds.

The Knowledge Academy offers various Business Intelligence Reporting Courses, including the Microsoft Power BI Course, Tableau Desktop Training, and DAX Training. These courses cater to different skill levels, providing comprehensive insights into How to Update Power BI Desktop.
Our Office Application Blogs cover a range of topics related to Power BI, offering valuable resources, best practices, and industry insights. Whether you are a beginner or looking to advance your Power BI skills, The Knowledge Academy's diverse courses and informative blogs have got you covered.

The Knowledge Academy takes global learning to new heights, offering over 30,000 online courses across 490+ locations in 220 countries. This expansive reach ensures accessibility and convenience for learners worldwide.
Alongside our diverse Online Course Catalogue, encompassing 17 major categories, we go the extra mile by providing a plethora of free educational Online Resources like News updates, Blogs, videos, webinars, and interview questions. Tailoring learning experiences further, professionals can maximise value with customisable Course Bundles of TKA.
Upcoming Microsoft Technical Resources Batches & Dates
Date
 Microsoft Power BI Course
Wed 15th Jan 2025
Wed 5th Feb 2025
Wed 9th Apr 2025
Wed 11th Jun 2025
Wed 6th Aug 2025
Wed 8th Oct 2025
Wed 3rd Dec 2025


 Top Rated Course


 If you wish to make any changes to your course, please


