


 Top Rated Course

We may not have the course you’re looking for. If you enquire or give us a call on 01344203999 and speak to our training experts, we may still be able to help with your training requirements.
20 Key Website Metrics for Measuring Success
Sophia Ellis 03 April 2025Website Metrics are used to evaluate the performance and a website’s effectiveness. These metrics include data related to traffic, user engagement and conversion rates. Learn how to track essential Website Metrics like page views, session duration, traffic sources, and bounce rates with our comprehensive blog on website analytics.
Training Outcomes Within Your Budget!
We ensure quality, budget-alignment, and timely delivery by our expert instructors.
Table of Contents

Your website is nothing short of a digital ecosystem keeping your products and services alive. But how do you know if it's truly thriving? The answer lies in the numbers spotlighted by Website Metrics. These metrics reveal what captivates visitors, drives conversions, and what aspect of your website needs a tune-up.
From page views and bounce rate to traffic sources and revenue attribution, these metrics provide much-needed insights into visitor behaviour and site efficiency. This blog outlines the 20 most essential Website Metrics that you need to monitor. So read on and crack the code for website success!
Table of Contents
1) What Are Website Metrics?
2) Most Important Web Analytics Metrics
a) Page Views
b) Bounce Rate
c) Traffic Sources
d) Social Referrals
e) New Visitor Sessions
f) Average Time on Page
g) Average Session Duration
h) Pages per Session
i) Conversion Rate
j) Event Tracking
3) Conclusion
What Are Website Metrics?
Website Metrics refer to quantitative, data-based measurements that help you evaluate your website’s performance. They generally track the following:
1) Traffic (visitor numbers)
2) Engagement (time spent on-site)
3) Conversion rates (actions taken)
4) Bounce rates (visitors leaving after one page).
Some metrics focus on technical aspects like Search Engine Optimisation (SEO) and page load time. These indicators help you gain insights into user behaviour and how effective your website is.
Most Important Web Analytics Metrics
In this section, we will explore the top 20 Web Analytics Metrics that can help you increase your website performance as well as your online presence. Let’s explore them below:
1) Page Views
A page view is the count of how many times a specific page on your website was loaded by a browser. Page views are a basic measure of your website traffic and popularity. They can also indicate the level of interest and engagement of your visitors with your content.
a) Each time a page on your website loads in a browser, it counts as one page view.
b) Also, if a visitor reloads the same page, it counts as two page views.
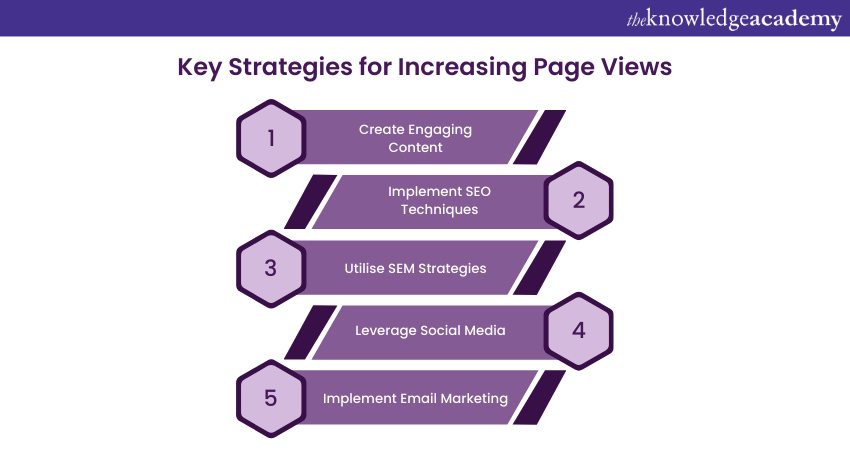
c) Create relevant, and eye-catching content to increase page views.
d) Employ Search Engine Optimisation (SEO) and Search Engine Marketing (SEM) to drive traffic.
e) You must master strategies such as Social Media Marketing, Email Marketing, and paid advertising to boost your visibility.

2) Bounce Rate
The bounce rate is the number of visitors who decide to leave your website after viewing just one page. A high bounce rate could mean any of the following:
a) Your visitors are not interested
b) They are not satisfied with your content
c) They did not find what they were looking for.
A low bounce rate means your visitors are engaged and are exploring more pages on your site Consider the following:
a) You can reduce the bounce rate by improving User Experience (UX) and aligning with visitor expectations.
b) Optimise your page’s speed, design, navigation, content, and calls to action.
c) Make good use of landing pages, pop-ups, and exit-intent surveys to encourage longer visits.
d) There’s another metric called engagement rate, which is the opposite of Bounce Rate. It measures the percentage of sessions that were engaged.
3) Traffic Sources
Traffic sources are the channels or mediums that bring visitors to your website and measure where your website traffic is coming from. They can be categorised into the following categories:
a) Direct: Users reach your website by entering the URL manually or using a browser bookmark. It can also include traffic with an unknown source due to issues with cookies or tracking codes.
b) Organic: Visitors arrive through non-paid search engine results. This can include Google, Bing, or DuckDuckGo.
c) Paid Search: In this case, traffic comes from users clicking on ads that are displayed in search engine results.
d) Referrals: Visitors land on your website through links from external websites.
e) Email: Traffic originates from links included in email campaigns.
f) Social: Visitors arrive through links shared on Social Media platforms
4) Social Referrals
Social referrals are a subset of traffic sources that measure how many visitors come to your website from Social Media platforms like Twitter X, Facebook, Instagram, LinkedIn, YouTube, etc. Social referrals are a sign of your Social Media presence and influence, as well as your content’s shareability and virality.
a) Craft and share relevant and engaging content for your Social Media audience.
b) Make good use of hashtags, mentions, tags, and stories to amplify visibility and reach.
c) Encourage your followers to share your content with their networks.
d) Don’t forget to offer incentives, contests, or giveaways as a reward for audience engagement.
Acquire skills to analyse data and derive actionable insights for business growth in our Web Analytics Course - register now!
5) New Visitor Sessions
New visitor sessions are the number or percentage of sessions on your website that are initiated by new visitors, i.e., visitors who have not visited your site before.
a) New visitor sessions help you measure your website’s ability to attract new customers.
b) You must use diverse Marketing Strategies and channels to reach new segments of the target market.
c) Go for remarketing and retargeting campaigns. This will help re-engage past visitors who did not convert.
6) Average Time on Page
Average time on page is a metric used for identifying the average amount of time your website visitors spend on a specific page on your website. It can be measured by dividing the total time spent on a page by the number of page views.
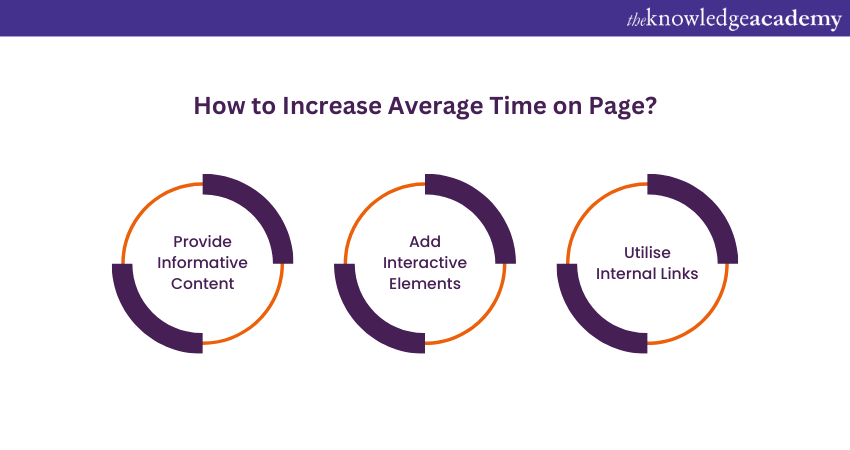
a) Average time on page indicates content quality, relevance, and visitor engagement.
b) To retain visitor interest, create content that are informative, entertaining, and captivating.
c) Amplify your content with multimedia elements like images, videos, audio, or interactive features.
d) Make good use of internal links, related posts, or suggestions to encourage visitors to explore more pages.
Want to master diverse strategies of digital store optimisation? Our Optimised Digital Store Training will guide you - Sign up now!
7) Average Session Duration
The Web Analytics Guide defines average session duration as the metric used to measure the average time visitors spend on a single session on your website. It is determined by dividing the total duration of all sessions by the number of sessions.
a) This metric measures the time visitors spend on your website before their session ends.
b) A longer session duration is generally desirable, but industry benchmarks may vary.
c) It reflects overall website performance, User Experience, visitor satisfaction, and loyalty.
d) Improve session duration by ensuring a fast, easy, and enjoyable browsing experience.
e) Offer valuable content, exclusive deals, discounts, or freebies to keep visitors engaged.
f) Use gamification, personalisation, and social proof to enhance engagement and build trust.
8) Pages per Session
Pages per session are the average number of pages that visitors view on your website during a single session. It can be measured by dividing the total page views by the number of sessions.
a) Pages per session measure website navigation, usability, and visitor engagement.
b) Ensure clear and intuitive menus, categories, and labels for easy browsing.
c) Use breadcrumbs, sitemaps, and search bars to help visitors find relevant content.
d) Implement cross-selling, upselling, and recommendations to showcase related content or products.
9) Conversion Rate
Conversion rate is the average number of website visitors who completed desired actions like signing up, subscribing, downloading, purchasing, etc. To increase your conversion rate, be sure to follow Conversion Rate Optimisation Tips like improving content and simplifying user flow. It is calculated by dividing the number of conversions by the number of visitors and serves as a measure of your website’s effectiveness, profitability, and customer loyalty.

So, if 20,000 total visitors view your landing page and 10,000 submit the form, your conversion rate will be 10,000 form submissions divided by 20,000 visitors (= 0.5) multiplied by 100 (= 50). That’s a 50% conversion rate.
a) You must optimise your website with clear forms, calls-to-action, landing pages, and checkout processes.
b) You can experiment with different elements and identify what works best through A/B testing, multivariate testing, or split testing.
c) Make good use of analytics and feedback tools to understand visitor behaviour and preferences.
d) Tailor your website based on insights to improve the user experience and conversions.
Increase conversion rates and achieve online business excellence with our Conversion Rate Optimisation Course – Sign up now!
10) Event Tracking
Every metric plays a role, and while tracking tools provide valuable insights, learning how to connect the dots between them gives a clearer picture of your website’s true performance. This is where event tracking proves invaluable. It's one of the most essential website metrics and captures custom events that standard tracking tools often overlook.
a) Event tracking is the process of measuring and recording specific actions or interactions that visitors perform on your website, such as clicking a button, filling out a form, playing a video, etc.
b) Event tracking helps monitor and analyse the performance of website elements like content, features, and design.
c) Define and set up events to track using a web analytics tool like HubSpot or Google Analytics.
d) Collect and report data to gain insights from tracked events.
e) Use insights to improve your website and achieve business goals.
11) Landing Pages
Landing pages are the initial pages on your website that visitors first arrive at, usually from external sources like a search engine, a Social Media platform, an email, or an ad.
a) Landing pages capture visitor attention and persuade them to take desired actions (e.g., signing up, subscribing, downloading, purchasing).
b) Ensure relevance, clarity, and engagement to optimise landing page effectiveness.
c) Use catchy headlines, engaging copy, and compelling visuals (images or videos) to attract interest.
d) Include strong calls to action to guide visitors toward conversions.
e) Leverage testimonials, reviews, and social proof to build credibility and trust.
12) Page Flow
Page flow is the sequence or path of pages that visitors follow on your website, from the landing page to the exit page. Page flow can help you understand how your visitors navigate and explore your site, what pages they visit, and what pages they leave.
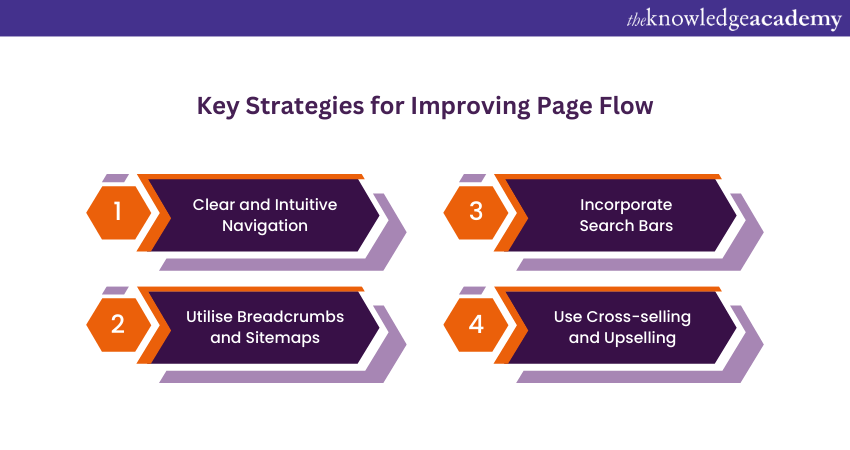
a) Page flow analysis helps identify popular, effective, or problematic pages and their impact on conversions and retention.
b) Ensure clear and intuitive navigation with well-structured menus, categories, and labels.
c) Use breadcrumbs, sitemaps, and search bars to help visitors find relevant content easily.
d) Implement cross-selling, upselling, and recommendations to guide visitors to related content or products.
Learn how to run successful PPC campaigns in our comprehensive Pay Per Click (PPC) Training - Sign up now!
13) Website Performance
Website performance is one of the most common Web Analytics Metrics used for measuring how fast, reliable, and secure your website is. Website performance can affect your website traffic, engagement, conversion, retention, and revenue, as well as your visitors’ satisfaction and loyalty.
a) Website performance is influenced by factors like web hosting, server, code, design, images, videos, and plugins.
b) Improving website performance enhances user experience and is a key benefit of web analytics metrics.
c) Monitor and optimise speed, availability, and security to maintain high performance.
d) Use web performance tools like Google PageSpeed Insights, Pingdom, or GTmetrix to analyse and enhance speed.
e) Choose reliable web hosting services such as Bluehost, HostGator, or SiteGround for better uptime and security.
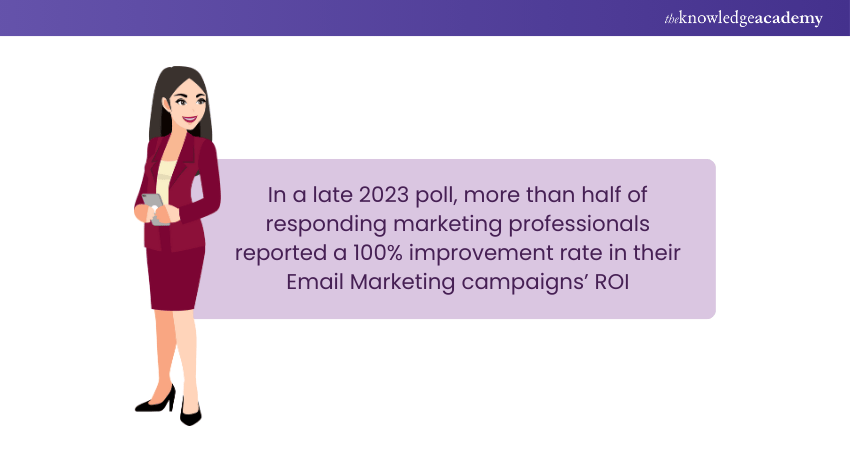
14) Email Metrics
Email metrics are the measures of how your Email Marketing campaigns perform and impact your website and business goals. Email metrics can include various indicators, such as open rate, click-through rate, conversion rate, bounce rate, unsubscribe rate, etc.
a) Email metrics measure the effectiveness and ROI of your Email Marketing strategy.
b) Optimise email content, design, and delivery to improve engagement and conversions.
c) Segment your email list to target the right audience with relevant content.
d) Personalise emails by tailoring content to recipients' interests and behaviours.
e) Test subject lines, headlines, copy, images, and calls-to-action to enhance performance.
f) Use Email Marketing tools like Constant Contact, AWeber, and Mailchimp to create, send, and track campaigns.
15) Campaign Audiences
Campaign audiences are the segments of your website visitors that are targeted by your marketing campaigns, such as ads, emails, Social Media posts, etc. Campaign audiences can help you understand who your potential customers are, what their characteristics, behaviours, and preferences are, and how they respond to your marketing messages and offers.
a) Use Web Analytics Tools like Google Analytics to gather visitor data.
b) Analyse demographics, location, interests, and behaviour to understand your audience.
c) Define and segment campaign audiences based on collected insights.
d) Tailor marketing campaigns to target specific audience groups effectively.
Decode the intricacies of consumer behaviour with our Consumer Behaviour Course – Sign up today!
16) Device Type
Device type is the category of devices that your visitors use to access your website, such as desktop, laptop, tablet, mobile, etc.
a) Device type analysis helps assess website performance and user experience across different devices.
b)Ensure a responsive website that adapts to various screen sizes and resolutions.
c) Use device detection, redirection, or adaptation techniques to deliver an optimised experience for each device type.
17) Exit Rate
Exit rate is the average number of visitors who decide to leave your website from a specific page. It is calculated by dividing the number of exits from a page by the number of page views.
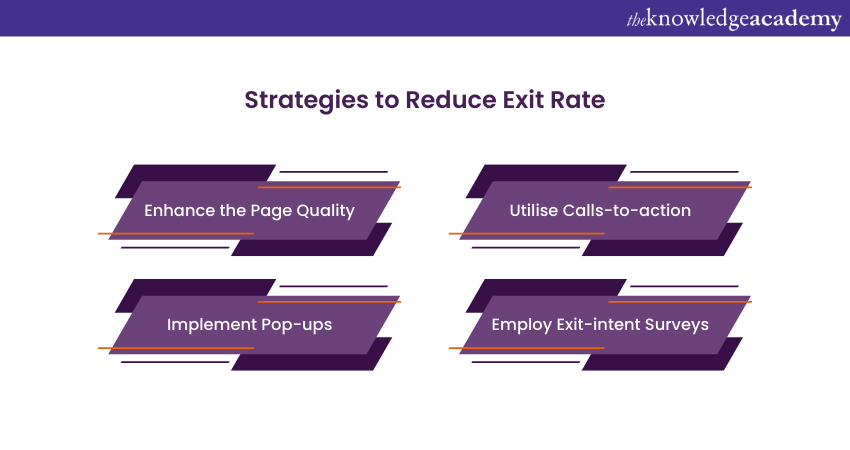
a) Exit rate differs from bounce rate, which tracks visitors leaving after a single-page session.
b) Exit rate measures the percentage of visitors who leave after viewing multiple pages.
c) Analysing exit rate helps identify pages that lead to visitor drop-offs.
d) Understanding exit pages can reveal issues affecting user engagement and retention.
e) Enhance page engagement by making content more relevant and valuable to visitors.
f) Use strong Calls-to-action (CTAs) to guide visitors toward further interaction.
g) Implement pop-ups or exit-intent surveys to capture visitor interest before they leave.
h) Encourage longer stays by offering additional content, recommendations, or incentives.
18) Top Pages
The top pages are the pages that receive the most traffic, engagement, or conversion. Top pages can help you understand what content, products, or offers are the most popular, effective, or profitable on your site and what makes them so.
a) Top pages analysis helps identify successful strategies to apply to other pages.
b) Create similar high-performing pages to enhance website growth and engagement.
c) Use web analytics tools like HubSpot or Google Analytics to track key metrics.
d) Analyse page views, time on page, bounce rate, and conversion rate to rank and compare pages.
e) Leverage insights from top pages to optimise content and improve overall website performance.
Become familiar with the strategies and tools pertaining to marketing strategies in our Business Marketing Strategies Training - Sign up now!
19) Top Exit Pages
Many websites have a multi-step conversion process, such as guiding visitors from an article to an eCommerce store and then encouraging subscriptions. However, visitors may drop off at any stage in this journey. To improve retention, identify your exit pages—the pages where most visitors leave your site. Understanding these pages helps refine your strategy and reduce drop-offs.
a) Top exit pages reveal which content, products, or offers are least engaging or profitable.
b) Identify issues that need fixing to reduce website attrition and improve retention.
c) Avoid creating similar underperforming pages to prevent further losses.
d) Use website analytics tools to track page views, time on page, bounce rate, and exit rate.
e) Analyse and compare pages to identify and address top exit pages effectively
20) Revenue attribution
Revenue attribution is the procedure of assigning credit or value to the marketing channels or campaigns that contributed to your website revenue or sales.
a) Revenue attribution helps measure the impact of marketing efforts on website and business goals.
b) Identify the most effective and profitable channels or campaigns for your site.
c) Use web analytics tools like Open Web Analytics to track revenue-related metrics (transactions, revenue, average order value).
d) Apply attribution models such as first-touch, last-touch, linear, or time-decay to assign value to marketing channels.
e) Leverage insights to optimise marketing strategies and improve ROI.
Conclusion
Website Metrics are essential for measuring and improving your website's success. By tracking and analysing the 20 Web Analytics Metrics outlined in this blog, you can gain valuable insights and data. You can then use these insights and data to optimise your website strategy, content, design, and user experience and achieve your website and business goals.
Transform your marketing prowess with our Marketing Courses – Sign up today!
Frequently Asked Questions
What are the Most Popular Tools for Measuring Website Metrics?
Numerous Website Analytics tools are available to track various website metrics. Many SaaS companies rely on the following platforms for data-driven insights:
a) Google Analytics
b) Statcounter
c) Crazyegg
d) SEMrush
e) Ahrefs
How can Website Metrics Help the Marketing Team?
Metrics enable marketing teams to monitor and evaluate a website's performance. Understanding its current state helps you strategise for future improvements and growth opportunities.
What are the Other Resources and Offers Provided by The Knowledge Academy?
The Knowledge Academy takes global learning to new heights, offering over 3,000 online courses across 490+ locations in 190+ countries. This expansive reach ensures accessibility and convenience for learners worldwide.
Alongside our diverse Online Course Catalogue, encompassing 19 major categories, we go the extra mile by providing a plethora of free educational Online Resources like News updates, Blogs, videos, webinars, and interview questions. Tailoring learning experiences further, professionals can maximise value with customisable Course Bundles of TKA.
What is The Knowledge Pass, and How Does it Work?
The Knowledge Academy’s Knowledge Pass, a prepaid voucher, adds another layer of flexibility, allowing course bookings over a 12-month period. Join us on a journey where education knows no bounds.
What are the Related Courses and Blogs Provided by The Knowledge Academy?
The Knowledge Academy offers various Marketing Courses, including the Website Conversion Rate Optimisation Training and the Web Analytics Course. These courses cater to different skill levels, providing comprehensive insights into Online Branding.
Our Digital Marketing Blogs cover a range of topics related to Website Analytics, offering valuable resources, best practices, and industry insights. Whether you are a beginner or looking to advance your Web Analytics skills, The Knowledge Academy's diverse courses and informative blogs have got you covered.
Upcoming Digital Marketing Resources Batches & Dates
Date
 Web Analytics Course
Web Analytics Course
Fri 6th Jun 2025
Web Analytics Course
Fri 8th Aug 2025
Web Analytics Course
Fri 3rd Oct 2025
Web Analytics Course
Fri 5th Dec 2025
 If you wish to make any changes to your course, please


