


 Top Rated Course

We may not have the course you’re looking for. If you enquire or give us a call on 01344203999 and speak to our training experts, we may still be able to help with your training requirements.
What is Grafana? A Comprehensive Introduction for Beginners
Gracey Smith 20 March 2025Wondering What is Grafana? Grafana is an incredible tool for visualisation of data, real-time monitoring of datasets and analysis of metrics. In this blog, therefore, we will elite its primary differentiators, how it assists organisations with now insights, and why it is indispensable for contemporary data observability. Let’s dive in!
Training Outcomes Within Your Budget!
We ensure quality, budget-alignment, and timely delivery by our expert instructors.

In this segment of Data analytics and Visualisation, we need to demystify Grafana – an open-source platform, used to query, visualise, alert, and explore our data, regardless of the data source’s location. No matter if you are venturing into the topic of DevOps,
Business Intelligence, or system monitoring, knowing What is Grafana? opens a great opportunity as the tool converts raw data into a story not so wither by complexity, making it a perfect companion for modern data lovers.
Created by Torkel Ödegaard, Grafana lets its users build engaging data dashboards, monitor metrics in real-time, and make valuable decisions. In this blog, you will get to understand What is Grafana and how this platform enables users to have a rich view of all their data and statistics and rendering of different data types from different data sources.
Table of Contents
1) Understanding What is Grafana
2) Key features of Grafana
3) How to use Grafana
4) Meaning of Grafana Cloud
5) Importance of Grafana
6) What is a Grafana Dashboard?
7) Difference between Grafana and Kibana
8) Conclusion
Understanding What is Grafana
Grafana is an open-source analytics and monitoring platform designed to empower users in visualising and understanding complex data. Developed by Torkel Ödegaard in 2014, Grafana has become a go-to tool for professionals across various domains.
Its versatility lies in its ability to seamlessly connect to diverse data sources, including databases, cloud services, and monitoring systems. With an intuitive and user-friendly interface, Grafana enables the creation of dynamic dashboards featuring a myriad of visualisation options such as graphs, tables, and heatmaps.
Moreover, this platform is not just a visualisation tool; it serves as a comprehensive solution for data exploration, analysis, and real-time monitoring. Whether used in DevOps for infrastructure oversight or in Business Intelligence for informed decision-making, Grafana remains an indispensable resource for harnessing the insights hidden within data.

Key Features of Grafana
It is used by large enterprises and start-ups across the globe and comes jam-packed with lots of present features to fulfill a lot of users’ requirements. Below is a list that describes the seven key features that define Grafana's prowess and make it an indispensable tool for data enthusiasts:
1) Visualisation Mastery
The following is the explanation of visualisation mastery:
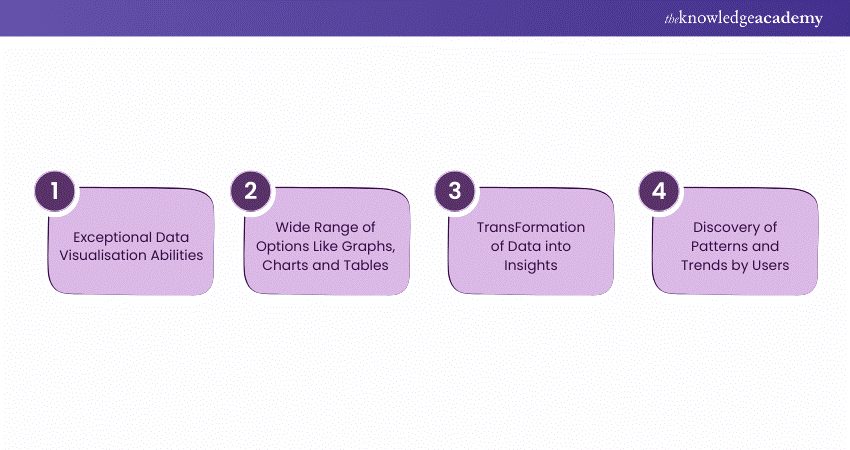
At the core of Grafana's appeal is its exceptional Data Visualisation capabilities. Offering a wide range of visualisation options, including graphs, charts, and tables, Grafana transforms raw data into insightful and aesthetically pleasing representations. This feature enables users to uncover patterns, trends, and anomalies within their data, fostering a deeper understanding of complex datasets.
Visualise your data and simplify your decisions with our Grafana Training Register today!
2) Alerting for Proactive Monitoring
If you talk about alerting — Grafana is a breakthrough solution in real-time monitoring on the planet. Custom alert rules allow users to define conditions that will trigger immediate notification to events of interest. This proactive approach enables teams to make a timely response on any matter which is likely to bring system performance to a standstill.
3) Data Unification Across Sources
A standout feature of Grafana is its ability to unify data from disparate sources seamlessly. Whether connecting to traditional databases, cloud services, or modern monitoring systems like Prometheus or InfluxDB, Grafana acts as a central hub, providing a unified view of data. This ensures a holistic understanding of an organisation's ecosystem.
Transform your data into actionable insights with our Business Intelligence Reporting Sign up today!
4) Open-source Flexibility
Being open-source, Grafana exemplifies flexibility and adaptability. Users can customise and extend its functionality through plugins and integrations, tailoring the platform to their unique requirements. The open-source nature also fosters a vibrant community, driving continuous innovation and the sharing of valuable resources.
5) Log Exploration for In-depth Analysis
This CDM discusses the merits of log exploration as means for identifying users’ actions, determining why technical problems occur, or assessing the effectiveness of a website. Marketers and developers can find much more specific information such as how often a server is crawled, bot activity, and any error routines in the server logs.
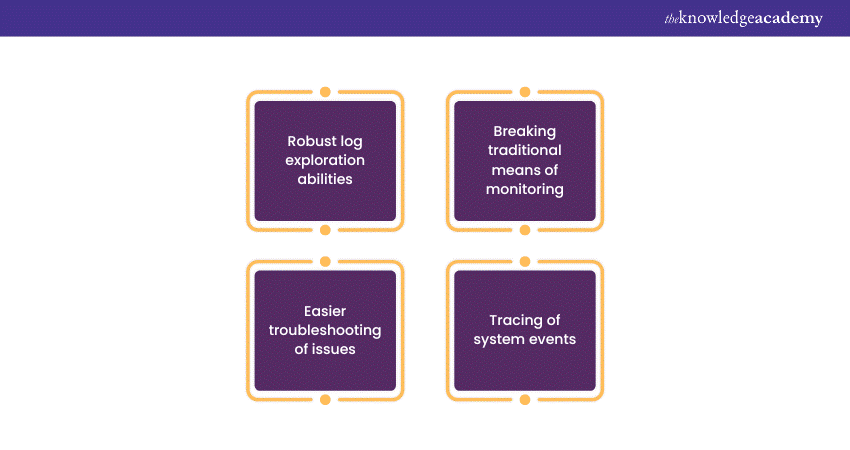
Grafana goes beyond traditional monitoring by offering robust log exploration capabilities. Integrated with tools like Loki, Grafana allows users to explore log data, making it easier to troubleshoot issues, trace system events, and gain deeper insights into the performance and health of applications.
6) Dynamic Dashboard Display
Creating dynamic and interactive dashboards is a breeze with Grafana. Users can arrange panels, leverage templating and variables, and create dashboards that adapt to changing data scenarios. This dynamic display ensures that stakeholders can interact with data in real-time, gaining meaningful insights effortlessly.
7) Report Creation and Sharing
Grafana empowers users to go beyond personal exploration by facilitating the creation of comprehensive reports. Users can compile dashboards into reports and share them with team members or stakeholders. This feature enhances collaboration and ensures that insights gleaned from data are communicated effectively across the organisation.
Turn data into decisions with our Business Objects Reporting - Sign up today!
How to Use Grafana
Every Data Visualisation platform is typically built around two primary functions which help organisations answer questions about their users and various events, have a look:
Data Tracking with Precision
Grafana excels in its ability to facilitate meticulous tracking through data visualisation. In the realm of monitoring and analytics, precise tracking of key metrics is essential for identifying trends, anomalies, and performance fluctuations.
Now Grafana is designed to offer a diverse range of visualisation options, including dynamic graphs, charts, and gauges, empowers users to track the evolution of data over time with unparalleled precision. The platform allows for real-time tracking, enabling instant visibility into system behaviours and responses.
Whether users need to monitor server performance, application metrics, or user interactions, Grafana's tracking capabilities provide a comprehensive view of data, allowing users to pinpoint issues, assess performance trends, and make informed decisions based on the evolving landscape of their datasets.
Compare Grafana and Datadog: Find the Best Monitoring Platform!
Data Analysis for Valuable Insights
Beyond mere tracking, Grafana elevates the data visualisation experience by offering in-depth analysis tools. Users can explore and analyse data through various lenses, applying filters, queries, and transformations to derive meaningful insights.
With features like annotations, users can correlate data points with external events, aiding in the contextual understanding of trends. The integration of logs and metrics enhances the analytical depth, allowing users to perform root cause analysis and troubleshoot issues effectively.
Grafana's commitment to facilitating detailed analysis ensures that users can uncover hidden patterns, outliers, and dependencies within their data, empowering them to make strategic decisions grounded in a thorough understanding of their datasets.
Whether engaged in Business Intelligence, infrastructure monitoring, or application performance analysis, Grafana's analytical capabilities make it a cornerstone for deriving actionable insights from complex datasets.
Consolidate and visualise your data in a unified manner by signing up for our Grafana Training now!
Meaning of Grafana Cloud
Grafana Cloud emerges as a game-changer in the world of observability, offering a comprehensive suite of features designed to meet the evolving needs of users across industries. Let's explore the five key features that define the prowess of Grafana Cloud:
1) Observation Platform Composable by Users
Many things that make Grafana Cloud beautiful is that an observation platform is composable. Based on the users’ needs and desires, they can choose the necessary components to add them into observability workflows. This composable approach allows users to assemble a unique and tailored observability stack tailored to their specific requirements.
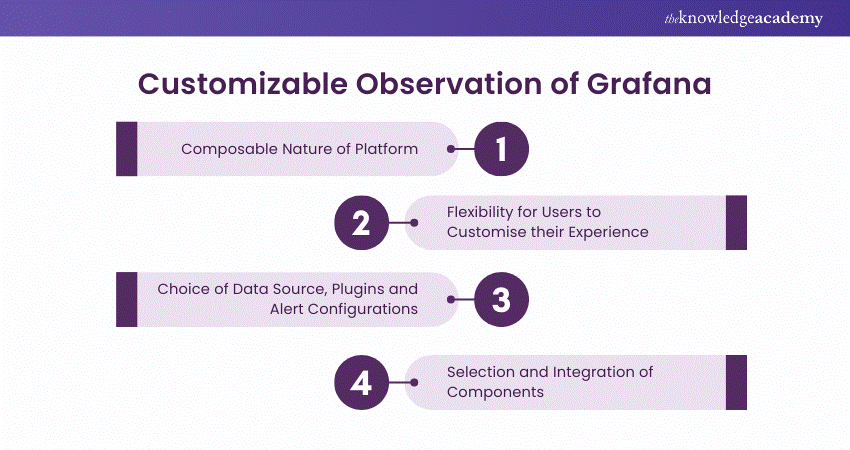
Now whether it's choosing data sources, adding plugins, or configuring alerting mechanisms, Grafana Cloud ensures that users have the autonomy to create an observation platform that precisely fits their needs, fostering a personalised and efficient monitoring experience.
2) Integrations for Turnkey Infrastructure
Grafana Cloud simplifies the integration process by providing turnkey solutions for diverse infrastructures. From traditional on-premises setups to cloud-native environments, Grafana Cloud seamlessly integrates with various data sources and services.
This turnkey approach not only accelerates the onboarding process but also ensures that users can quickly derive insights from their infrastructure without the complexities of extensive setup and configuration. Grafana Cloud's integrations pave the way for a smooth and efficient observability experience, regardless of the intricacies of the underlying infrastructure.
3) Cost-efficient and Massive-scale Observability
Grafana Cloud addresses the scalability demands of modern applications and infrastructures with its cost-efficient and massive-scale observability capabilities. The platform is designed to handle large volumes of data, making it well-suited for organisations with extensive monitoring needs.
Furthermore, the scalability is complemented by a cost-efficient model, allowing users to scale their observability efforts without breaking the bank. Grafana Cloud's architecture ensures that observability scales seamlessly with the growth of data and infrastructure, providing a cost-effective solution for organisations of all sizes.
4) Low Total Cost of Ownership (TCO) and Operational Overhead
Grafana Cloud stands out for its commitment to minimising the Total Cost of Ownership (TCO) and operational overhead associated with observability. The platform streamlines processes, automates routine tasks, and offers a managed service model that reduces the burden on users in terms of maintenance and operational complexities.
Now by minimising TCO and operational overhead, Grafana Cloud allows organisations to allocate resources efficiently, focusing on deriving value from observability insights rather than managing the intricacies of the underlying infrastructure.
5) Built-in Security and Cloud Administration
Grafana Cloud enables features as well as powerful cloud admin to meet a security requirement in Cloud. To spell it out, the platform has adopted standard requirements in data and communication security so that secret data is safeguarded.
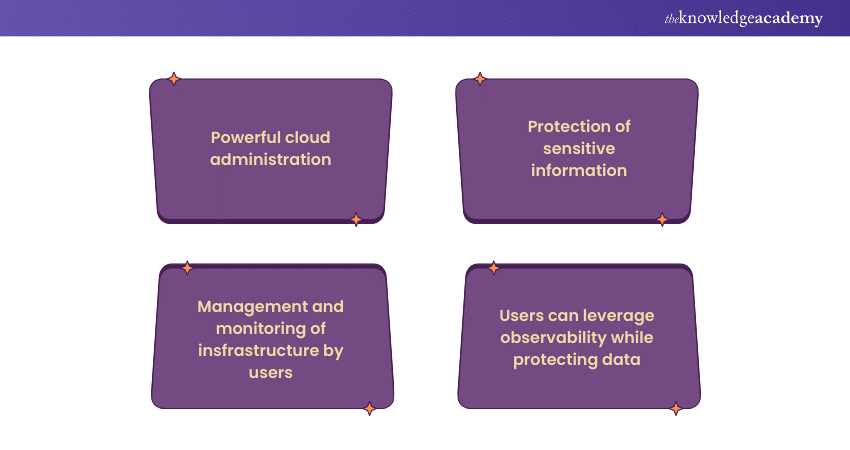
Grafana Cloud's cloud administration tools provide users with the means to manage and monitor their observability infrastructure securely. From identity and access management to encryption and compliance features, Grafana Cloud's commitment to security instils confidence in users, allowing them to leverage observability without compromising on data protection.
Importance of Grafana
Grafana plays a pivotal role in organisations, serving as a linchpin for Data Visualisation, analytics, and monitoring. Its significance lies in its ability to transform raw data into actionable insights, empowering decision-makers across various departments.
In DevOps, Grafana facilitates real-time monitoring of system performance and infrastructure, ensuring optimal operations. For Business Intelligence, it acts as a dynamic tool for creating executive dashboards, fostering data-driven decision-making.
Moreover, Grafana's open-source nature fosters a collaborative community, driving continuous innovation and expanding its capabilities. Its versatility in connecting to diverse data sources, coupled with an intuitive interface, makes it indispensable for tracking, analysing, and visualising data. For those preparing for a Grafana-related role, reviewing Grafana Interview Questions and Answers can help solidify your understanding of its key features.
What is a Grafana Dashboard?
Grafana Dashboards stand as the command centre for organisations, consolidating data from diverse sources and providing a visually compelling interface for users. Let's explore the key features that make Grafana Dashboards an indispensable asset in the domain of Data Analytics and monitoring:

1) Centralising Data
At the heart of Grafana Dashboards is their ability to centralise data from a myriad of sources. Whether it's databases, cloud services, or monitoring tools like Prometheus and InfluxDB, Grafana acts as a unified hub, providing a single point of access to critical data. This centralisation simplifies the monitoring process, enabling users to have a holistic view of their entire ecosystem in one consolidated space.
2) Visualising Data
Grafana's prowess in data visualisation is unparalleled. The dashboard provides an extensive array of visualisation options, including line graphs, bar charts, heatmaps, and more. This visual richness transforms raw data into meaningful insights, making trends, patterns, and anomalies instantly recognisable. Users can customise the appearance of data, selecting the most suitable visual representation for their specific use cases.
3) Real-time Monitoring
Grafana Dashboards excel in facilitating real-time monitoring, a crucial feature for staying on top of dynamic systems and rapidly changing data. Whether tracking website traffic, server performance, or application metrics, Grafana ensures that users have up-to-the-second insights into the state of their environment. Real-time monitoring is instrumental in detecting and addressing issues promptly, minimising downtime and optimising overall system performance.
4) Performance Analysis
Performance analysis is elevated through Grafana Dashboards, providing a comprehensive toolkit for dissecting system behaviours. Users can drill down into specific metrics, correlate data points, and gain a deep understanding of performance trends. This feature is invaluable for optimising resource allocation, identifying bottlenecks, and ensuring that systems operate at peak efficiency.
5) Troubleshooting
Grafana Dashboards are an indispensable tool for troubleshooting, offering a visual and intuitive environment for diagnosing issues. The platform's ability to integrate with log exploration tools like Loki enhances troubleshooting capabilities, allowing users to correlate log data with performance metrics. This holistic approach streamlines the identification and resolution of problems, reducing downtime and enhancing system reliability.
6) Custom Reporting
Beyond real-time monitoring and troubleshooting, Grafana Dashboards facilitate custom reporting, enabling users to compile and share insights. Whether creating executive summaries or detailed operational reports, Grafana allows users to tailor reports based on specific metrics and KPIs. The platform's export features ensure that these reports can be easily shared across teams, fostering collaboration and knowledge dissemination.
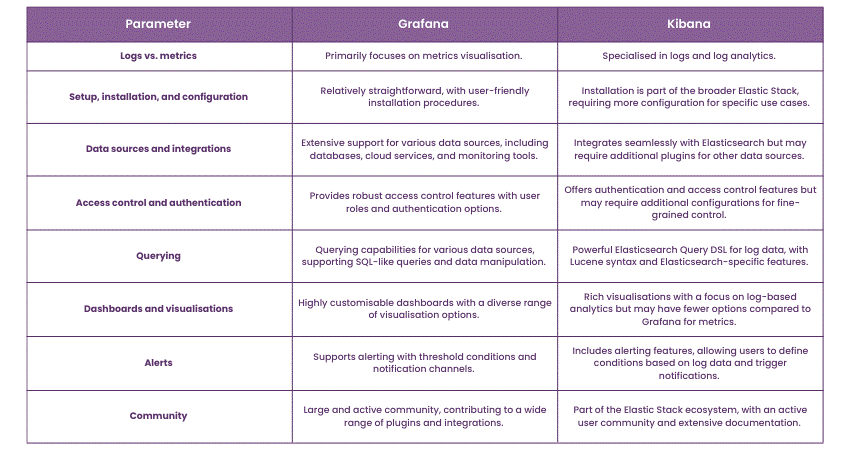
Difference Between Grafana and Kibana
Here are the various distinctions between Grafana and Kibana highlighted below:
Conclusion
In conclusion, Grafana emerges as a versatile powerhouse for Data Visualization and monitoring. This comprehensive platform, with its user-friendly interface, extensive data source support, and real-time insights, helps users answer their doubts pertaining to What is Grafana. While Grafana is highly effective, exploring Grafana alternatives can also provide unique features and tailored solutions for specific needs, offering users a broader perspective on data visualization tools. Grafana essentially empowers users to transform complex datasets into actionable insights, fostering informed decision-making and efficient data-driven operations.
From strategy to execution with our Flow Chart and Process Mapping Training - Join today!
Frequently Asked Questions
Why Grafana is so Popular?
It has grown popular to it due to its flexibility coupled with rich data visualisation features. They interact with Prometheus, InfluxDB, Elasticsearch and more to support interactive dashboards. Being an open-source system, simple to be scaled and customised, Basecamp is among the most used tool to monitor and analyse.
Is Grafana a Data Visualisation Tool?
Yes, Grafana is a data visualisation tool that is uses for creating highly interactive real time display. It supports multiple data sources, by which, users can easily manage, analyse, and visualise metrics. Being highly flexible and customisable, Grafana is perfect for performance, monitoring, and analysing.
What are the Other Resources and Offers Provided by The Knowledge Academy?
The Knowledge Academy takes global learning to new heights, offering over 3,000 online courses across 490+ locations in 190+ countries. This expansive reach ensures accessibility and convenience for learners worldwide.
Alongside our diverse Online Course Catalogue, encompassing 19 major categories, we go the extra mile by providing a plethora of free educational Online Resources like News updates, Blogs, videos, webinars, and interview questions. Tailoring learning experiences further, professionals can maximise value with customisable Course Bundles of TKA.
What is The Knowledge Pass, and How Does it Work?
The Knowledge Academy’s Knowledge Pass, a prepaid voucher, adds another layer of flexibility, allowing course bookings over a 12-month period. Join us on a journey where education knows no bounds.
What are the Related Courses and Blogs Provided by The Knowledge Academy?
The Knowledge Academy offers various Business Intelligence Reporting, including the Grafana Training, JasperReports Training and the DAX Training. These courses cater to different skill levels, providing comprehensive insights into Business Intelligence.
Our Office Application Blogs cover a range of topics related to Grafana, offering valuable resources, best practices, and industry insights. Whether you are a beginner or looking to advance your Business Management skills, The Knowledge Academy's diverse courses and informative blogs have got you covered.
Upcoming Office Applications Resources Batches & Dates
Date
 Grafana Training
Grafana Training
Fri 16th May 2025
Grafana Training
Fri 18th Jul 2025
Grafana Training
Fri 19th Sep 2025
Grafana Training
Fri 21st Nov 2025
 If you wish to make any changes to your course, please


