


 Top Rated Course

We may not have the course you’re looking for. If you enquire or give us a call on 01344203999 and speak to our training experts, we may still be able to help with your training requirements.
What is R Programming? A Complete Guide
Gracey Smith 25 March 2025R programming is a powerful language and environment for statistical computing and graphics. In this blog, we learn about Programming, explore its capabilities and applications, and why it's a go-to choice for data analysis. Discover how R programming can unlock insights from your data and revolutionise your analytical endeavours.
Training Outcomes Within Your Budget!
We ensure quality, budget-alignment, and timely delivery by our expert instructors.
Table of Contents
R Programming Language is a robust and versatile tool widely used for statistical computing, Data Analysis, and graphical representation. It is one of the widely used programming languages with great career prospects. If you are interested in pursuing a career with this, you first need to learn What is R Programming Language is all about.
According to Glassdoor, the median salary of an R Programmer in the UK is £55,372 annually. So learning R has lots of benefits. In this blog, you will learn What is R Programming, how to get started with it, along with its benefits. Let's examine deeper to learn more!
Table of Contents
1) What is R Programming?
2) Getting started with R
3) Data manipulation in R
4) Statistical analysis with R
5) Benefits of R Programming Language
6) Conclusion
What is R Programming?
R programming is a powerful and widely used language designed specifically for statistical computing and data analysis. Features of R Programming include its extensive package ecosystem, robust data visualization capabilities, and strong community support. Developed initially by Ross Ihaka and Robert Gentleman at the University of Auckland, New Zealand, in the early 1990s, R has evolved into one of the most preferred languages for data scientists, statisticians, and analysts worldwide. Feel free to ask if you need further modifications or additional information!
Brief history and evolution of R
R emerged as an open-source implementation of the S Programming Language, which originated from John Chambers and his colleagues at Bell Laboratories. Its development as an open-source project allowed a thriving community of developers to contribute, resulting in rapid growth and continuous enhancements.
Importance and applications of R
R's flexibility and extensive library of packages, including Updating Rlang, have made it a staple tool for a wide range of applications. It finds extensive use in academia, research, and various industries, including finance, healthcare, marketing, and social sciences. R's statistical capabilities and visualization tools make it a top choice for data-driven decision-making.
Getting Started with R
In order to get started with R, you need to install R and RStudio, an Integrated Development Environment (IDE) that simplifies coding in R. RStudio provides a user-friendly interface, making it easier for beginners to write and execute R scripts.
Basic syntax and data structures in R
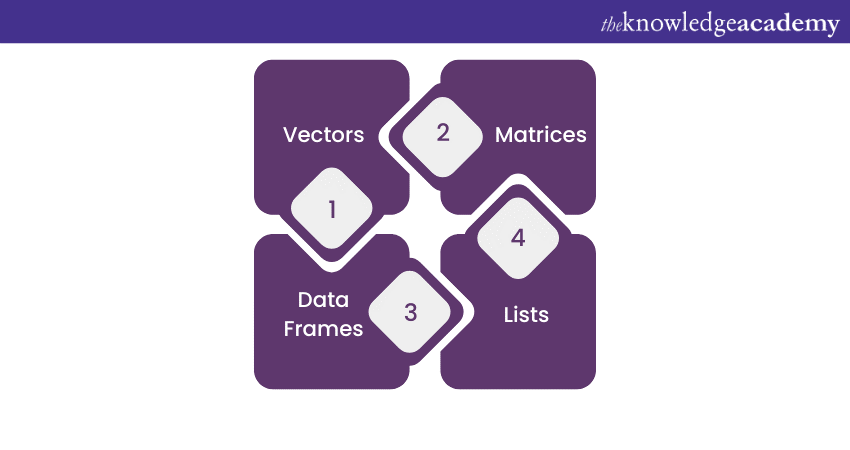
R follows a straightforward syntax, allowing users to perform operations on data efficiently. It supports various data structures such as vectors, matrices, data frames, and lists, enabling users to manipulate data effectively, including handling number series for analytical computations.
R packages and libraries
One of R's greatest strengths lies in its vast collection of packages and libraries. These packages extend R's functionality, offering specialised tools for Data Analysis, machine learning, data visualisation, and more.
Data manipulation in R
Data manipulation is a crucial aspect of Data Analysis, and R provides a rich set of tools and functions to handle data efficiently. In this section, we will explore various techniques for importing, cleaning, preprocessing, and transforming data using R.
Importing and exporting data in R
R supports various file formats, making it easy to bring in and export data from external sources. Commonly used functions for data import include read.csv(), read.table(), and read_excel(). Similarly, data can be exported to different formats using functions like write.csv() and write. table().
Data cleaning and preprocessing techniques
Before analysing data, it's essential to ensure its quality and accuracy. Data cleaning involves identifying and handling missing values, duplicate entries, and outliers. R provides functions like na.omit(), duplicated(), and outlierTest() to aid in data cleaning.
Transforming and reshaping data using R functions
R offers versatile functions to transform data into the desired format. Functions like filter(), select(), and mutate() from the dplyr package allow users to manipulate data and create new variables easily. Additionally, the tidyr package provides functions like gather() and spread() for data reshaping.
Aggregating data with R
R simplifies the process of aggregating data with functions like aggregate(), tapply(), and group_by() from the dplyr and plyr packages. These functions enable users to calculate summary statistics and perform group-wise operations efficiently.
Merging and joining data frames
Combining data from multiple sources is a common task in Data Analysis. R offers functions like merge() and join() to merge and join data frames based on common keys or columns.
Handling dates and times in R
Dates and time are crucial elements in many datasets. R provides a set of functions to handle date-time data, including formatting, parsing, and performing arithmetic operations on dates.
Dealing with strings and text data
Text data often requires processing and analysis. R has a range of functions for string manipulation, such as pattern matching, text substitution, and text splitting.
Working with factors in R
Factors are categorical variables used to represent discrete data. R's factor() function is used to create factors, and functions like levels() and reorder() are used for factor manipulation.
Resampling and random sampling
In statistical analysis, resampling and random sampling are essential techniques for estimating population parameters. R provides functions like sample(), boot(), and resample() for these purposes.
Data aggregation and pivot tables
Creating pivot tables and performing data aggregation is made easy with the aggregate() and xtabs() functions in R. These tools enable users to summarise data and create meaningful insights.
Data manipulation is a fundamental skill for Data Analysts, and R's extensive set of functions and packages make it a powerful tool for handling and transforming data. By mastering these techniques, analysts can ensure data accuracy and derive valuable insights from their datasets.
Excel in analytics and visualisation with our specialised R Programming Training. Sign up now!
Statistical analysis with R
R is a powerful tool for conducting statistical analysis, providing a wide range of functions and packages to explore data and derive meaningful insights. Let's take a look into various statistical techniques that can be performed using R:
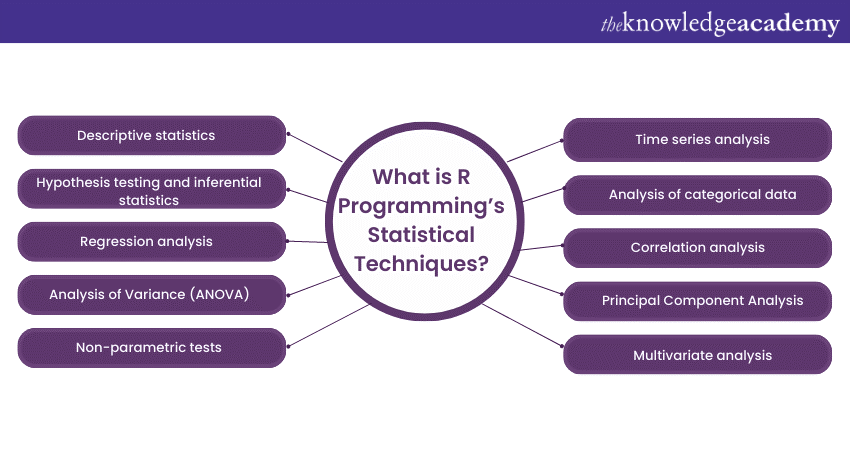
1) Descriptive statistics: Descriptive statistics offer a summary of data, providing measures such as mean, median, mode, variance, and standard deviation. R's summary() function and other descriptive statistics functions aid in understanding data distributions and central tendencies.
2) Hypothesis testing and inferential statistics: This is a fundamental aspect of statistical analysis. R offers functions like t.test(), wilcox.test(), and chisq.test() for conducting various hypothesis tests based on different types of data and assumptions.
3) Regression analysis: Regression Analysis helps establish relationships between variables. R provides functions for simple linear regression (lm()) and multiple linear regression (glm()), enabling users to build predictive models.
4) Analysis of Variance (ANOVA): ANOVA is used to compare means between multiple groups. R's aov() function allows users to conduct ANOVA and assess the importance of differences between groups.
5) Non-parametric tests: R supports non-parametric tests like the Wilcoxon rank-sum test, Kruskal-Wallis test, and Mann-Whitney U test. These tests are useful when data does not follow a normal distribution or when assumptions for parametric tests are not met.
6) Time series analysis: Time series data requires specialised techniques for analysis. R offers packages like ts and forecast to handle time series data and perform forecasting.
7) Analysis of categorical data: For categorical Data Analysis, R provides functions for creating and interpreting contingency tables and performing chi-square tests.
8) Correlation analysis: Correlation analysis helps measure the relationship between variables. R's cor() function computes correlation coefficients and functions like cor.test() perform significance tests on correlations.
9) Principal Component Analysis (PCA): PCA is used for dimensionality reduction and data visualisation. R's prcomp() function is commonly used for PCA.
10) Multivariate analysis: Multivariate analysis techniques, such as cluster analysis and factor analysis, can be conducted using R packages like stats and FactoMineR.
Statistical analysis is at the core of data-driven decision-making. R's extensive statistical functions and packages empower Data Analysts to explore data, test hypotheses, and draw conclusions. By harnessing the power of R, analysts can unlock valuable insights from their datasets and make informed business decisions.
Crack Your Next Interview! Master Key R Programming Interview Questions and Answers.
Benefits of R Programming Language
R programming language is a versatile and powerful tool widely used for statistical computing, Data Analysis, and graphical representation. Its popularity stems from a range of advantages, discussed as part of the broader Advantages of R Programming, that cater to the needs of data scientists, statisticians, and analysts. Let's explore some key benefits.
1) Open-source and free: R is freely available for all, fostering a vibrant community of developers and users who continuously enhance the language.
2) Extensive package ecosystem: R boasts numerous packages covering data manipulation, statistical analysis, machine learning, data visualisation, and more.
3) Statistical computing power: R is purpose-built for rigorous statistical analysis, making it a go-to language for researchers and statisticians.
4) Data visualisation capabilities: R Programming Tools offer powerful data visualization libraries like ggplot2 and plotly, facilitating clear communication of insights.
5) Community support: The active R community provides abundant resources and a positive learning environment.
6) Compatibility and integration: R seamlessly integrates with Python and other languages, as well as databases and data sources. The R Programming Language and Python are both popular choices for data analysis, each offering unique features and strengths.
7) Reproducibility and scripting: R encourages reproducible research through scripts and markdown documents.
Transform your data into captivating visuals and elevate your storytelling with our Data Visualisation Training With D3. Sign up now!
Conclusion
We hope you read and understand What is R Programming. Its versatility, powerful statistical computing and data visualisation capabilities make it a top choice for Data Analysts and researchers. Its active community support adds to its appeal in data-driven decision-making.
Unlock your data mastery and code your way to success with our comprehensive Programming Training. Sign up today!
Frequently Asked Questions
Upcoming Programming & DevOps Resources Batches & Dates
Date
 R Programming Course
R Programming Course
Fri 4th Apr 2025
R Programming Course
Fri 27th Jun 2025
R Programming Course
Fri 29th Aug 2025
R Programming Course
Fri 24th Oct 2025
R Programming Course
Fri 5th Dec 2025
 If you wish to make any changes to your course, please


