


 Top Rated Course

We may not have the course you’re looking for. If you enquire or give us a call on +44 1344 203 999 and speak to our training experts, we may still be able to help with your training requirements.
20 Key Web Analytics Metrics for Measuring Success
Eliza Taylor 18 December 2024This blog explains what Web Analytics Metrics are, why they are important for your website growth, and how to track and improve them. It also provides a list of 20 essential Web Analytics Metrics that you should monitor and optimise, along with their definitions, benefits, and best practices.

Training Outcomes Within Your Budget!
We ensure quality, budget-alignment, and timely delivery by our expert instructors.
Table of Contents

Web Analytics is the procedure of collecting, analysing, and reporting data about the behaviour and performance of your website and its visitors. Web Analytics Metrics play a key role in this process. It can help you understand how users find, interact, and convert on your site. Besides, it helps identify areas of improvement and opportunities for growth.
However, Web Analytics Metrics can also be overwhelming, as there are hundreds of metrics and dimensions that you can measure and track. How do you know which ones are the most relevant and impactful for your website goals? How do you use them to make data-driven decisions and optimise your website strategy? Let's find out!
In this blog, you will learn about the 20 key Web Analytics Metrics that you should track for measuring your website success. Let’s dive in to learn more!
Table of Contents
1) Most Important Web Analytics Metrics
a) Page views
b) Bounce rate
c) Traffic sources
d) Social referrals
e) New visitor sessions
f) Average time on page
g) Average session duration
h) Pages per session
i) Conversion rate
j) Event tracking
2) Conclusion
Most Important Web Analytics Metrics
In this section, we will explore the top 20 Web Analytics Metrics that can help you increase your website performance as well as your online presence. Let’s explore them below:
1) Page views
A page view is the count of how many times a specific page on your website was loaded by a browser. Page views are a basic measure of your website traffic and popularity. They can also indicate the level of interest and engagement of your visitors with your content.
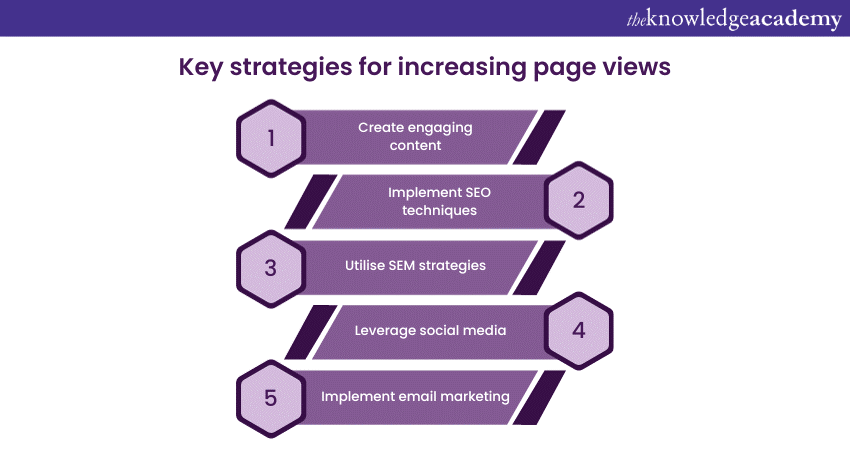
In order to increase your page views, you need to create quality, relevant, and engaging content that attracts and retains your target audience. You can also implement Search Engine Optimisation (SEO) and Search Engine Marketing (SEM)techniques for driving more traffic. Implementing techniques like social media marketing, email marketing, and paid advertising can also help drive more traffic to your site.

2) Bounce rate
The bounce rate is the number of visitors who decide to leave your website after viewing just one page. A high bounce rate means that your visitors are not interested or satisfied with your content or that they did not find what they were looking for. A low bounce rate means that your visitors are engaged and explore more pages on your site.
To reduce your bounce rate, you need to improve your user experience and match your visitors’ expectations and intent. You can do this by optimising your page speed, design, navigation, content, and calls to action. You can also use landing pages, pop-ups, and exit-intent surveys to capture your visitors’ attention and encourage them to stay longer or take action.
3) Traffic sources
Traffic sources are the channels or mediums that bring visitors to your website. They can be categorised into four categories:
1) Organic
2) Direct
3) Referral
4) Social
Organic traffic comes from search engines. Direct traffic, on the other hand, comes from users typing your URL or using bookmarks. Referral traffic originates from other websites linking to yours, and social traffic comes from social media platforms.
Traffic sources can help you understand how your visitors discover your site, what keywords they use, and what websites or platforms they trust. They can also help you evaluate the effectiveness of your marketing campaigns and strategies and allocate your budget and resources accordingly.
To increase your traffic sources, you need to diversify your marketing channels and optimise your website for each one. You can use SEO, content marketing, link building, influencer marketing, and guest blogging to boost your organic and referral traffic. You can use email marketing, push notifications, and branded keywords to increase your direct traffic. You can use social media marketing, viral marketing, and user-generated content to grow your social traffic.
4) Social referrals
Social referrals are a subset of traffic sources that measure how many visitors come to your website from social media platforms like Twitter X, Facebook, Instagram, LinkedIn, YouTube, etc. Social referrals are a sign of your social media presence and influence, as well as your content’s shareability and virality.
To increase your social referrals, you need to generate and share content that is relevant, engaging, and valuable for your social media audience. You can also use hashtags, mentions, tags, and stories to increase your visibility and reach. You can also encourage your followers and fans to share your content with their networks and reward them with incentives, contests, or giveaways.
5) New visitor sessions
New visitor sessions are the number or percentage of sessions on your website that are initiated by new visitors, i.e., visitors who have not visited your site before. New visitor sessions are a measure of your website’s ability to attract new and potential customers and expand your audience and market.
To increase your new visitor sessions, you need to use various marketing tactics and channels to reach and appeal to new segments of your target market. You can also use remarketing and retargeting campaigns to bring back visitors who have visited your site before but did not convert.
6) Average time on page
Average time on page is a metric used for identifying the average amount of time your website visitors spend on a specific page on your website. It can be measured by dividing the total time spent on a page by the number of page views. The average time on the page is an indicator of your content’s quality and relevance, as well as your visitors’ interest and engagement.
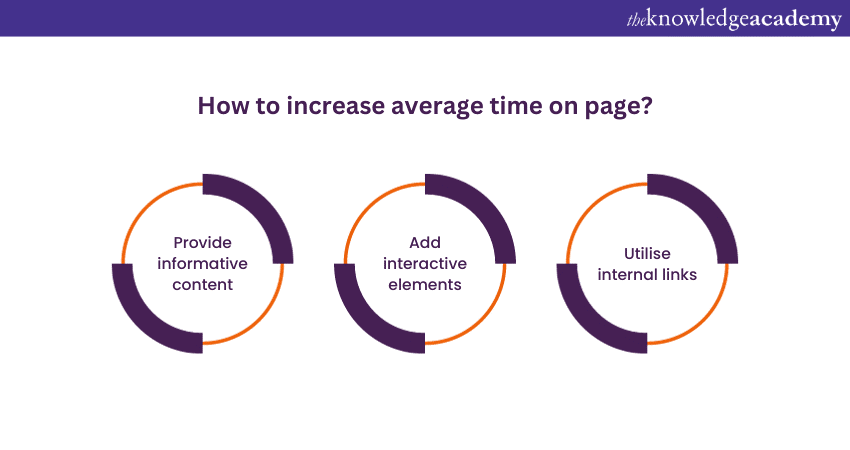
To increase your average time on the page, you need to create an ad that is informative, entertaining, and captivating for your visitors. You can also add multimedia elements like images, videos, audio, or interactive features to enhance your content and make it more appealing. You can also use internal links, related posts, or suggestions to keep your visitors on your site longer.
7) Average session duration
Average session duration is the metric used for gauging the average amount of time that your website visitors spend on a single session. It is calculated by dividing the total period of all sessions by the number of sessions. Average session duration is a measure of your website’s overall performance and user experience, as well as your visitors’ satisfaction and loyalty.
To increase your average session duration, you need to provide a fast, easy, and enjoyable browsing experience for your visitors. You can also offer more value and variety to your visitors, such as exclusive content, offers, discounts, or freebies. You can also use gamification, personalisation, or social proof to increase your visitors’ engagement and trust.
8) Pages per session
Pages per session are the average number of pages that visitors view on your website during a single session. It can be measured by dividing the total page views by the number of sessions. Pages per session are a measure of your website’s navigation and usability, as well as your visitors’ curiosity and exploration.
To increase your pages per session, you need to make your website easy to navigate and browse with clear and intuitive menus, categories, and labels. You can also use breadcrumbs, sitemaps, or search bars to help your visitors find what they are looking for. You can also use cross-selling, upselling, or recommendations to show your visitors more relevant and related content or products.
9) Conversion rate
Conversion rate is the average number of website visitors who completed desired actions like signing up, subscribing, downloading, purchasing, etc. It is calculated by dividing the number of conversions by the number of visitors. Conversion rate is a measure of your website’s effectiveness and profitability, as well as your visitors’ satisfaction and loyalty.
To increase your conversion rate, you need to optimise your website for conversions by using clear and compelling calls-to-action, landing pages, forms, and checkout processes. You can also use A/B testing, multivariate testing, or split testing to test with different elements and variations of your website and find out what works best for your visitors. You can also use analytics and feedback tools to understand your visitors’ behaviour and preferences and tailor your website accordingly.
Increase conversion rates with our Website Conversion Rate Optimisation Masterclass – Sign up now!
10) Event tracking
Event tracking is the process of measuring and recording specific actions or interactions that visitors perform on your website, such as clicking a button, filling out a form, playing a video, etc. Event tracking can help you monitor and analyse the performance and impact of your website elements, such as content, features, or design.
To use event tracking, you need to define and set up the events that you want to track on your website using a Web Analytics tool, such as HubSpot or Google Analytics. You can then view and report the data and insights that you collect from your event tracking and use them to improve your website and achieve your goals.
11) Landing pages
Landing pages are the initial pages on your website that visitors first arrive at, usually from external sources like a search engine, a social media platform, an email, or an ad. Landing pages are important for capturing your visitors’ attention and interest and persuading them to take a desired action or goal, such as signing up, subscribing, downloading, purchasing, etc.
To optimise your landing pages, you need to make them relevant, clear, and compelling for your visitors. You can do this by writing catchy headlines, engaging copy, attractive images or videos, and strong calls to action. You can also use testimonials, reviews, or social proof to increase your credibility and trustworthiness.
12) Page flow
Page flow is the sequence or path of pages that visitors follow on your website, from the landing page to the exit page. Page flow can help you understand how your visitors navigate and explore your site, what pages they visit, and what pages they leave. It can also help you identify the most popular, effective, or problematic pages on your site and how they affect your conversions and retention.
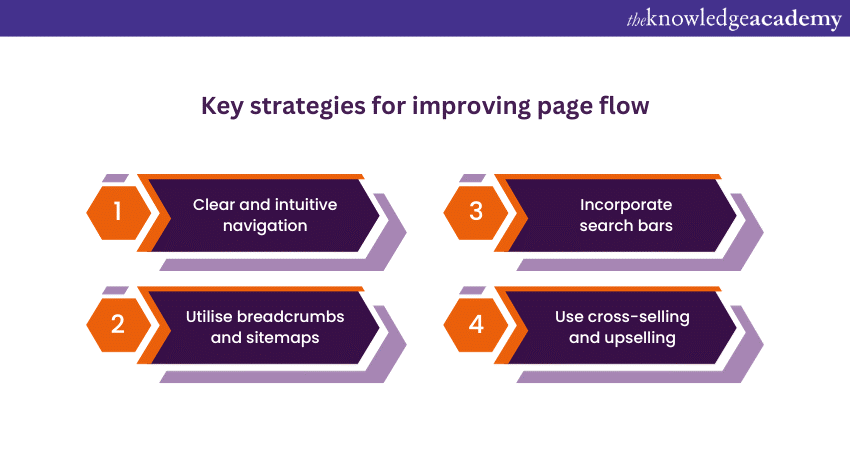
To improve your page flow, you need to make your website easy to navigate and browse with clear and intuitive menus, categories, and labels. You can also use breadcrumbs, sitemaps, or search bars to help your visitors find what they are looking for. You can also use cross-selling, upselling, or recommendations to show your visitors more relevant and related content or products.
13) Website performance
Website performance is one of the most common Web Analytics Metrics used for measuring how fast, reliable, and secure your website is. Website performance can affect your website traffic, engagement, conversion, retention, and revenue, as well as your visitors’ satisfaction and loyalty. Website performance can be influenced by various factors, such as your web hosting, server, code, design, images, videos, plugins, etc. Increased website performance is one of the main Benefits of Web Analytics Metrics.
To improve your website performance, you need to monitor and optimise your website speed, availability, and security. You can do this by using web performance tools, such as Google PageSpeed Insights, Pingdom, or GTmetrix, to analyse and improve your website speed. You can also use web hosting services, such as Bluehost, HostGator, or SiteGround, to ensure your website availability and security.
14) Email metrics
Email metrics are the measures of how your email marketing campaigns perform and impact your website and business goals. Email metrics can include various indicators, such as open rate, click-through rate, conversion rate, bounce rate, unsubscribe rate, etc. Email metrics can help you evaluate the effectiveness and ROI of your email marketing strategy and optimise your email content, design, and delivery.
To improve your email metrics, you need to segment your email list, personalise your email content, and test your email subject lines, headlines, copy, images, calls-to-action, etc. Moreover, you can also use email marketing tools like Constant Contact, AWeber, and Mailchimp to create, send, and track your email campaigns.
15) Campaign audiences
Campaign audiences are the segments of your website visitors that are targeted by your marketing campaigns, such as ads, emails, social media posts, etc. Campaign audiences can help you understand who your potential customers are, what their characteristics, behaviours, and preferences are, and how they respond to your marketing messages and offers.
In order to create and manage your campaign audiences, you can use Web Analytics tools, such as Google Analytics or HubSpot, to collect and analyse data about your website visitors, such as their demographics, location, interests, etc. You can then use this data to create and define your campaign audiences and tailor your marketing campaigns accordingly.
Decode the intricacies of consumer behaviour with our Consumer Behaviour Masterclass – Sign up today!
16) Device type
Device type is the category of devices that your visitors use to access your website, such as desktop, laptop, tablet, mobile, etc. Device type can help you understand how your website performs and displays on different devices and how your visitors’ behaviour and experience vary across devices.
To optimise your website for different device types, you need to make your website responsive, i.e., able to adapt and adjust to different screen sizes and resolutions. You can also use device detection, redirection, or adaptation techniques to deliver the most suitable version of your website for each device type.
17) Exit rate
Exit rate is the average number of visitors who decide to leave your website from a specific page. It is calculated by dividing the number of exits from a page by the number of page views. Exit rate is totally different from bounce rate, as bounce rate measures the average number of visitors who leave your website after browsing just one page.
Exit rate measures the average number of visitors who leave your website after viewing more than one page. Exit rate can help you identify the pages that are causing your visitors to leave your site and the reasons behind it.
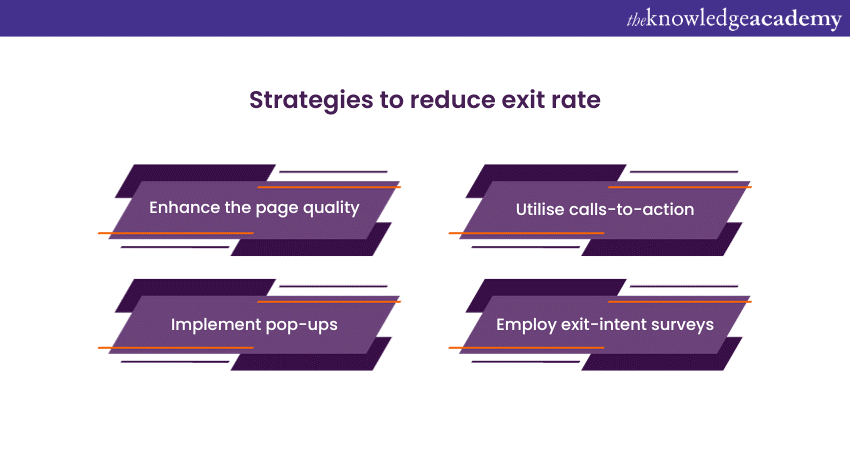
To reduce your exit rate, you need to make your pages more engaging, relevant, and valuable for your visitors. You can also use calls-to-action, pop-ups, or exit-intent surveys to capture your visitors’ attention and encourage them to stay longer or take action.
18)Top pages
The top pages are the pages that receive the most traffic, engagement, or conversion. Top pages can help you understand what content, products, or offers are the most popular, effective, or profitable on your site and what makes them so. Top pages can also help you identify strategies you can implement for other pages on your site or create more similar pages to increase your website performance and growth.
To find and analyse your top pages, you can use Web Analytics tools like HubSpot or Google Analytics to track and report the data and metrics of your pages, such as page views, time on page, bounce rate, conversion rate, etc. You can then use this data to rank and compare your pages and discover your top pages.
19) Top exit pages
The top exit pages are the pages where the most visitors leave your site. Top exit pages can help you understand what content, products, or offers are the least popular, effective, or profitable on your site and what makes them so. Top exit pages can also help you identify the problems and issues that you need to fix or improve on your site or avoid creating more similar pages to reduce your website attrition and loss.
To find and analyse your top exit pages, you can use Website Analytics tools to find and report the data and metrics of your pages, such as page views, time on page, bounce rate, exit rate, etc. You can then use this data to rank and compare your pages and discover your top exit pages.
20) Revenue attribution
Revenue attribution is the procedure of assigning credit or value to the marketing channels or campaigns that contributed to your website revenue or sales. Revenue attribution can help you understand how your marketing efforts and investments impact your website and business goals and what channels or campaigns are the most effective and profitable for your site.
To perform revenue attribution, you need to use Web Analytics tools like Open Web Analytics to track and report the data and metrics of your website revenue or sales, such as transactions, revenue, average order value, etc. You can then use this data to create and apply different attribution models, such as first-touch, last-touch, linear, or time-decay, to assign credit or value to your marketing channels or campaigns.
Conclusion
Web Analytics Metrics are essential for measuring and improving your website's success. By tracking and analysing the 20 Web Analytics Metrics that we discussed in this blog, you can gain valuable insights and data. You can then use these insights and data to optimise your website strategy, content, design, and user experience and achieve your website and business goals.
Transform your marketing prowess with our Marketing Courses – Sign up today!
Frequently Asked Questions
Upcoming Digital Marketing Resources Batches & Dates
Date
 Web Analytics Course
Web Analytics Course
Fri 7th Feb 2025
Web Analytics Course
Fri 4th Apr 2025
Web Analytics Course
Fri 6th Jun 2025
Web Analytics Course
Fri 8th Aug 2025
Web Analytics Course
Fri 3rd Oct 2025
Web Analytics Course
Fri 5th Dec 2025
 If you wish to make any changes to your course, please


