We may not have the course you’re looking for. If you enquire or give us a call on +41 315281584 and speak to our training experts, we may still be able to help with your training requirements.
Training Outcomes Within Your Budget!
We ensure quality, budget-alignment, and timely delivery by our expert instructors.

The Fixed Asset Turnover Ratio (FATR) measures how efficiently a company uses its fixed assets—such as buildings, equipment, and machinery—to generate revenue. It shows how much sales are earned for every dollar invested in these long-term assets. This metric is particularly important in asset-heavy industries like manufacturing, retail, and logistics, where effective use of infrastructure directly impacts profitability.
A higher FATR indicates that a company is using its assets efficiently, while a lower ratio may highlight underutilisation or inefficiencies. Businesses can use this ratio to optimise asset usage and plan future investments, while investors rely on it to gauge how well a company leverages its resources. Comparing the ratio with industry benchmarks offers deeper insights into operational performance and growth potential.
Table of Contents
1) What is the Fixed Asset Turnover Ratio?
2) Fixed Asset Turnover Ratio Formula
3) How to Calculate Fixed Asset Turnover Ratio?
4) Examples of Fixed Asset Turnover Ratio
5) What Constitutes a Strong Fixed Asset Turnover Ratio?
6) Drawbacks of Fixed Asset Ratio
7) Differences Between Fixed Asset Turnover Ratio and Asset Turnover Ratio
8) Conclusion
What is the Fixed Asset Turnover Ratio?
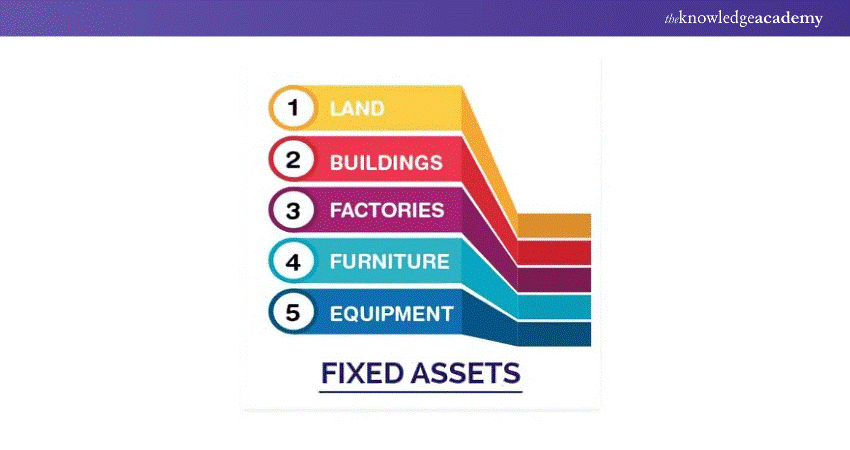
The Fixed Asset Turnover Ratio (FAT) is a key financial metric that evaluates how effectively a company can utilise its fixed assets to generate sales. Fixed assets are physical/ tangible assets that a company owns and employs in their business operations for providing goods and services to its customers. These equipments or properties act as a long-term investment with significant financial benefits.

Continue reading below to learn about the significant turnover a company can generate from its fixed assets such as buildings, computer equipment, software, furniture, land, machinery and vehicles. The fixed asset ratio demonstrates how adequately a company generates sales from its existing assets. A higher ratio typically indicates that the management is employing its fixed assets more effectively.
Fixed Asset Turnover Ratio Formula
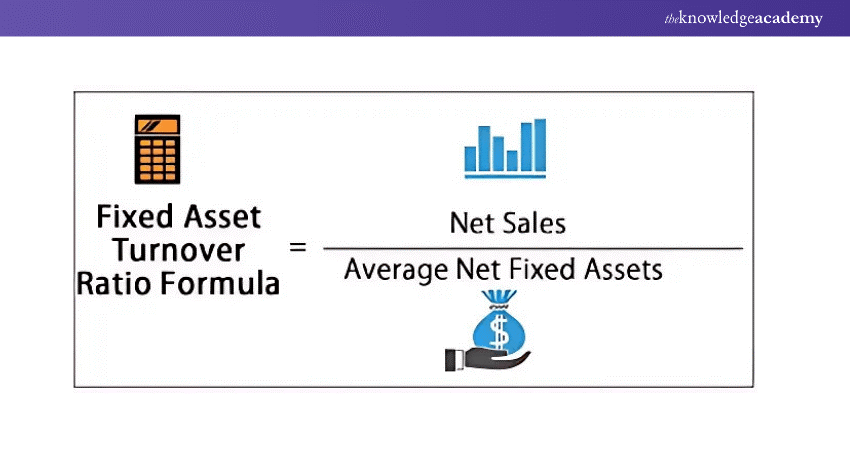
To calculate the Fixed Asset Turnover Ratio, you use the following formula:
Fixed Asset Turnover Ratio= Net Sales / Average Fixed Assets
Where:
a) Net Sales: It represents the total revenue generated from the sale of goods or services, excluding returns or discounts.
b) Average Fixed Assets: It refers to the average value of a company's Fixed Assets over a specific period. It is calculated as the sum of the Fixed Assets at the beginning and end of the period, divided by two.

How to Calculate Fixed Asset Turnover Ratio?
Calculating the Fixed Asset Turnover Ratio is a simple task as long as you have the required financial information. Let's simplify it by breaking it down step by step.
1) Calculate Net Sales: Determine the overall revenue displayed on the company's income statement. Sales returns, allowances, or discounts must be excluded from net sales.
2) Determine Average Fixed Assets: Determine the valuation of the company's Fixed Assets (land, buildings, and machinery) at the start and end of the reporting period. Sum up these values and then divide the total by two to calculate the average Fixed Assets.
3) Utilise The Formula: Dividing the net sales by the average Fixed Assets in order to calculate the Fixed Asset Turnover Ratio.
If a company's net sales amount to £600,000 and its average Fixed Assets total £300,000, the Fixed Asset Turnover Ratio (FATR) can be calculated as shown below:
Fixed Asset Turnover Ratio= 600,000/300,000 = 2
This means that for every pound invested in Fixed Assets, the company will generate £2 in sales.
Master the accounting and management with our Fixed Assets Accounting and Management Course Register now!
Examples of Fixed Asset Turnover Ratio
Clothing Brand has annual gross sales of £10M in a year, with sales returns and allowances of £10,000. Its net Fixed Assets’ beginning balance was £1M, while the year-end balance amounts to £1.1M.
Fixed Asset Turnover Ratio= 10,000,000/1,000,000 = 10
According to the data provided, the Fixed Asset Turnover Ratio for the year is 9.51. This indicates that for every pound invested in Fixed Assets, nearly ten pounds are generated in return. The average net Fixed Asset value is determined by summing the beginning and ending balances and then dividing it by two.
What Constitutes a Strong Fixed Asset Turnover Ratio?
A “strong” Fixed Asset Turnover Ratio is going to differ relatively between industries. Businesses that require a significant amount of infrastructure investment will have lower FATR, common among businesses of the capital-intensive type (like utilities or even those in manufacturing). Other businesses, less reliant on Fixed Assets, such as service-based companies or retail storefronts instead of factories, generally exhibit higher ratios.
The higher the FATR, usually the more efficient. Basically, the company effectively turns its Fixed Assets into sales revenue, and it does make a profit. Yet a very high FATR may also suggest underinvestment in resources, which could harm future growth or production capacity.
Become a certified lead implementer with our ISO 55001 Lead Implementer Training Register now!
Drawbacks of Fixed Asset Ratio
The FATR is a helpful metric, but there are certain limitations to be aware of. These are:
a) Industry Differences: The FATR is subject to substantial variance across industries. A decent Ratio in one sector may be considered bad in another. It is critical not to compare across industries, as this leads to erroneous findings.
b) Exclusively Fixed Assets: The measurement takes into account only Fixed Assets and overlooks current ASSETs, short-term liabilities, and intangibles. While it is an indicator of operational performance, it does not reflect the company’s overall financial health.
c) Depreciation Impact: The FATR may be artificially inflated for older companies that no longer have depreciable Fixed Assets. This is not a measure of better operational performance but an accounting notation for older Fixed Assets.
d) Asset Quality: The flat rate fails to factor in the quality or performance of Assets. A high Ratio could mean that the company is overworking outdated, poorly maintained equipment that is a liability to long-term performance.
Differences Between Fixed Asset Turnover Ratio and Asset Turnover Ratio
The following are the key differences between the Fixed Asset Turnover Ratio and the Asset Turnover Ratio:

Conclusion
The Fixed Asset Turnover Ratio is essential for understanding how effectively a company uses its Fixed Assets to generate sales. This blog explores its Formula, calculation, and examples, highlighting the importance of industry context and the ratio’s limitations. A higher Ratio typically reflects better Asset utilisation, but factors like depreciation must be considered. Understanding this metric helps businesses make informed decisions about Asset management and improve profitability.
Boost your asset management skills with our ISO 55001 Foundation Training Sign up now!
Frequently Asked Questions

The key factors that contribute to Asset Turnover are:
a) Increasing Revenue
b) Improving Inventory Management
c) Selling Assets
d) Leasing Instead of Buying Assets
e) Improve Efficiency

When a company utilises its Fixed Assets more effectively to drive sales, its Fixed Asset Turnover Ratio will rise. A higher proportion shows that a company has less capital invested in Fixed Assets per unit of revenue generated.

The Knowledge Academy takes global learning to new heights, offering over 30,000 online courses across 490+ locations in 220 countries. This expansive reach ensures accessibility and convenience for learners worldwide.
Alongside our diverse Online Course Catalogue, encompassing 19 major categories, we go the extra mile by providing a plethora of free educational Online Resources like News updates, Blogs, videos, webinars, and interview questions. Tailoring learning experiences further, professionals can maximise value with customisable Course Bundles of TKA.

The Knowledge Academy’s Knowledge Pass, a prepaid voucher, adds another layer of flexibility, allowing course bookings over a 12-month period. Join us on a journey where education knows no bounds.

The Knowledge Academy offers various ISO 55001 Training, including the ISO 55001 Foundation Training and Practitioner Course, and the ISO 55001 Lead Auditor Training. These courses cater to different skill levels, providing comprehensive insights into Asset Manager.
Our IT Service Management Blogs cover a range of topics related to ISO 55001, offering valuable resources, best practices, and industry insights. Whether you are a beginner or looking to advance your Asset Management skills, The Knowledge Academy's diverse courses and informative blogs have got you covered.
Upcoming IT Service Management Resources Batches & Dates
Date
 ISO 22301 Foundation Training
Mon 3rd Feb 2025
Mon 31st Mar 2025
Mon 16th Jun 2025
Mon 6th Oct 2025


 Top Rated Course


 If you wish to make any changes to your course, please


