We may not have the course you’re looking for. If you enquire or give us a call on +41 315281584 and speak to our training experts, we may still be able to help with your training requirements.
We ensure quality, budget-alignment, and timely delivery by our expert instructors.

Ready to turn your messy data into beautiful, interactive stories? Power BI Desktop is here to help! This amazing tool from Microsoft lets you create stunning reports and dashboards effortlessly. With features like data modelling, advanced visualisations, and easy integration, it's perfect for Data Analysts. Dive into this blog to learn all about Power BI Desktop, from how to install it to keep it updated. Let's make your data not just informative but truly captivating!
Table of Contents
1) What is Power BI?
2) Understanding What is Power BI Desktop
3) Requirements for Power BI Desktop
4) How to Install Power BI Desktop?
5) How does Power BI Desktop Work?
6) Considerations and Limitations
7) How to Update Power BI Desktop?
8) What are the Key Features of Power BI Desktop?
9) Can I Use Power BI Desktop Without Coding Knowledge?
10) Conclusion
What is Power BI?
Microsoft Power BI is an integrated platform that combines a suite of tools, services, and connectors. It’s designed to transform complex data from various sources into customisable reports and dashboards.
With Power BI, you can bring your business data to life through vivid graphs and charts tailored to specific parameters and showcased as interactive visualisations—or ‘tiles’—on your dashboard.
The Power BI Architecture acts as a bridge, turning data into strategic insights. It leverages components like Power Query, Power View, and Power Map, utilising advanced AI and natural language processing to precisely answer critical business queries.
Understanding What is Power BI Desktop
Microsoft Power BI Desktop is a computer-installed application for Data Analysis and report creation. It allows users to assemble dashboards and live reports that paint a picture of the business’s health. When connected with Power BI Service, these insights can be shared with the organisation's main players, aiding them in informed decision-making.
This tool consolidates various analytical features into one user-friendly platform. Power BI’s intuitive interface is crafted so that even those without deep technical knowhow can create detailed reports, sophisticated data models, and personalised dashboards.
Let’s delve into the workings of Power BI Desktop and see how it can transform your data into decisions.
Master the usage of DAX with our Microsoft Power BI Data Analyst PL300 Course!
Requirements for Power BI Desktop
There are certain requirements to run the Power BI Desktop tool within your system; some of these requirements are as follows:

Operating System: Ideally, you should have Windows 8.1, Windows Server 2012 R2 or later versions
Framework: .NET 4.6.2 or later versions
Web Browser: Microsoft Edge browser (Internet Explorer is no longer supported)
Memory (RAM): A minimum of 2 GB, but 4 GB or more is recommended.
Display: At least “1440x900” or “1600x900” (16:9) is required. Lower resolution displays such as “1024x768” or “1280x800” aren’t supported because some controls, such as closing the startup screens, are displayed beyond those resolutions.
CPU: 1 gigahertz (GHz) 64-bit (x64) processor or better recommended.
WebView2: If WebView2 wasn’t automatically installed with the BI Desktop tool or if it was uninstalled, download and run the installer for WebView2.
Lastly, try to keep your display settings at 100% to efficiently use Power BI Desktop. If you change the size of apps, texts or other items to more than 100%, you won’t see any dialogues you must interact with to continue using BI Desktop. To address the issue, please navigate to the Display section in the Windows Settings by clicking on Settings, then System, and finally Display. Adjust the slider until the display settings are back to 100%. This is an important consideration for optimal use, regardless of whether you're working with SSRS vs Power BI for your reporting needs.
Learn data visualisation in Power BI with Microsoft Power BI Course!
How to Install Power BI Desktop?
You should ensure that your computer meets the minimum system requirements specified by Microsoft. Once your system meets the requirements, you can proceed with the installation process. Your first option is to head to the Microsoft Store and simply choose “Get”, which will automatically install it for you. Alternatively, you can manually download it using the following steps.
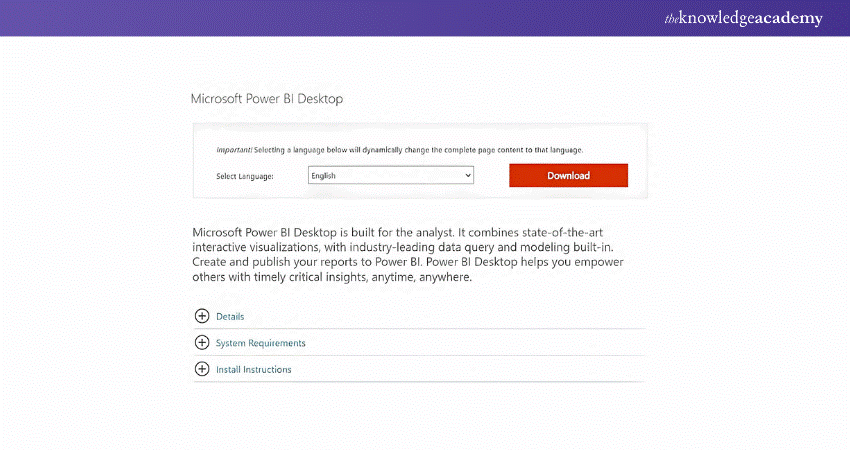
1) Download the Installer: Click on this link to visit the official Microsoft Power BI website. Select your preferred language and click on the "Downloads" section. Click next to proceed with the download.
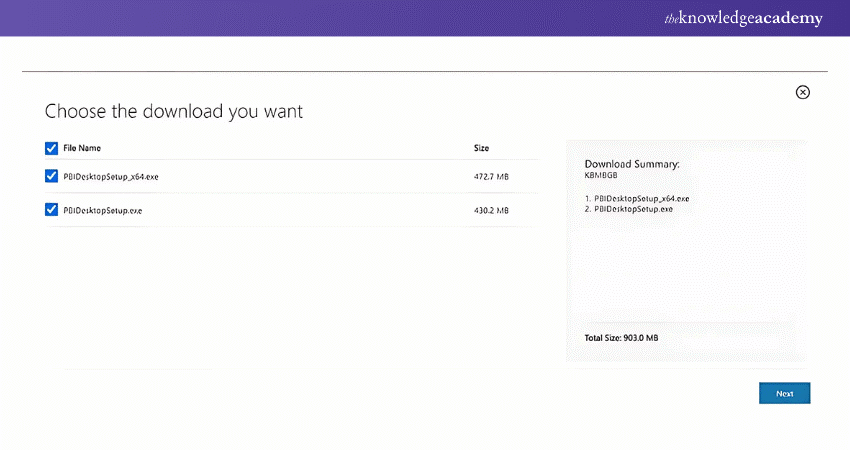
2) Run the Installer: Once the BI Desktop download is complete, find the installer file you downloaded and double-click on it to run the installation wizard. This will launch the BI Desktop installation process.
3) Choose Installation Options: The setup wizard will navigate you through several choices. You’ll have the flexibility to select the directory for installing Power BI Desktop on your system. Additionally, it may offer you the choice to generate shortcuts on your desktop or in the Start menu for quick application access. Examine these choices carefully and decide based on your convenience.
4) Accept the License Agreement: During installation, you will encounter the Microsoft Power BI Desktop license agreement. It’s important to carefully review the terms of the agreement. You must acknowledge your agreement by selecting the checkbox to proceed with the installation. Installation will not continue without this acceptance.
5) Begin Installation: After accepting the license agreement, click the “Install” or “Next” button to initiate the installation process. Then the installer will start copying the necessary files to your computer.
6) Wait for Installation: Depending on the size of the installation files and the computer speed, the installation process may take a few minutes to finish. The progress bar will update you on the installation status, enabling you to track the progress.
7) Launch Power BI Desktop: After installation is finished, you can launch BI Desktop immediately. If you wish to launch it right away, make sure the corresponding checkbox is selected. Alternatively, you can launch BI Desktop manually later by accessing it through the Start menu or using the desktop shortcut created during the installation.
8) Sign in or Skip Sign-in: When you start BI Desktop, you might need to log in using your Microsoft account. If you already have an account, you can enter your login details to sign in. However, if you don’t have an account or prefer to skip the sign-in process, you can choose the “Skip” or “Not now” option.
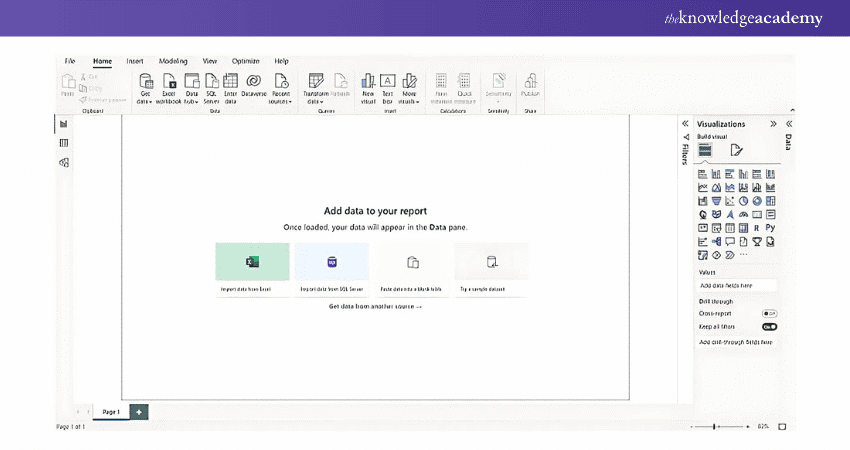
9) Start Using Power BI Desktop: After signing in or skipping the sign-in process, the Microsoft BI Desktop application will open, presenting you with its User Interface. You can now explore this tool’s various features and functionalities to create reports, dashboards, and visualisations. Familiarise yourself with the interface and begin leveraging the power of Power BI to analyse and visualise your data.
Develop necessary skills for Data Analysis with our comprehensive Business Intelligence Reporting Course – Register now!
How Does Power BI Desktop Work?
Power BI Desktop operates through a streamlined four-step process to transform raw data into insightful reports. Here’s a breakdown of how it works:
Connecting to Data Sources
Power BI Desktop can pull data from various sources, including Excel, CSV files, online services, and cloud storage. The data can vary from structured to unstructured, depending on the nature of your business. Initially, you’ll connect to these sources and import the data subject to a 10 GB limit. You might need to upgrade to Power BI Pro or query the data sources directly for larger datasets.
Transforming Data and Crafting Models
With the Power Query Editor, you can refine your data by extracting key information, eliminating inconsistencies, and imposing conditions for clarity. It’s akin to carving a sculpture—trimming, smoothing, and shaping until it meets your vision. You can also adjust columns and data types and fill in missing values. Power BI simplifies what might be a complex task in other Data Analytics Tools, making data modelling as easy as drag-and-drop.
Creating Visuals
Visuals are the heart of your data story, with Power BI Desktop offering tools to create charts, graphs, maps, and KPIs with simple drag-and-drop actions. These visuals become the building blocks of your dashboards and reports, helping to highlight issues and guide decisions. If you’re looking for inspiration to start, exploring some Power BI Project Ideas can be a great way to get started and understand the possibilities.
Generating and Sharing Reports
A report is a compilation of visuals drawn from various data models. It may include several dashboards, each with its own set of custom visuals. Live reports offer a real-time glimpse into data as it flows in. Once you’ve crafted these detailed and visually engaging reports, you can share them with colleagues and stakeholders online through Power BI Desktop, facilitating a shared understanding and collaborative decision-making. This is a great opportunity to Create a Strong Power BI Resume by showcasing your ability to create dynamic, real-time reports.
Considerations and Limitations
Here are two essential points to remember:
1) Power BI Desktop is updated and released monthly, incorporating diverse customer feedback and fresh features. Only the most recent version is supported. If you contact support for Power BI Desktop, you'll be advised to upgrade to the most recent version.
2) For data and reporting that must stay on-premises, there's a separate and specialised version of Power BI called Power BI Report Server. It uses a separate version of Power BI Desktop, (Power BI Desktop for Power BI Report Server) which is updated thrice a year.
How to Update Power BI Desktop?
Microsoft Power BI Desktop is a widely used Data Analytics and Visualisation tool. Microsoft regularly releases updates, including new features and connectors, every month.
If you’ve installed Power BI Desktop following the instructions from a previous section, you’ll need to update the software manually. Alternatively, updates will occur automatically if installed via the Microsoft Store, though this method may occasionally introduce minor bugs.
a) To manually update Power BI Desktop, follow these steps:
b) Launch Power BI Desktop.
c) Navigate to File > Options and Settings > Options.
d) In the Options window, go to the Updates section.
e) Check the option to receive updates.
f) Click OK to confirm.
By enabling this setting, Microsoft will notify you of available updates, allowing you to keep your software up-to-date with the latest enhancements.
Learn the concepts of logging and configuration with our Microsoft BI Training – Sign up now!
What are the Key Features of Power BI Desktop?
Features of Power BI Desktop include:
1) Data modelling
2) Interactive visualisations
3) DAX (Data Analysis Expressions) for advanced calculations
4) Ability to connect to numerous data sources including Excel, SQL Server, and Cloud-based platforms
5) Supports custom visuals and collaboration through Power BI Service
Can I Use Power BI Desktop Without Coding Knowledge?
Yes, Power BI Desktop is designed to be user-friendly for non-technical users. It offers drag-and-drop functionality and built-in tools to create visuals and reports. However, learning some basic coding in DAX or Power Query M can help users unlock advanced customisations.
Want to excel in data analytics? Find out How to Become a Power BI Consultant and start your consulting journey today!
Conclusion
In conclusion, Power BI Desktop is a game-changer in the field of data visualization. To fully understand its role in your workflow, knowing the difference between Alteryx and Power BI will ensure you make the best choice for your data analysis needs. For those considering their options, a comparison of Crystal Reports vs Power BI can offer further clarity on which tool best suits your needs. For those evaluating various BI tools, a Cognos vs Power BI comparison can provide additional insights into how Power BI stacks up against other leading platforms in the market.
Take control of data insights with our Business Intelligence Reporting Courses, Signup Now!
Frequently Asked Questions
How Does Power BI Desktop Differ From Power BI Service?

Power BI Desktop is a free, downloadable tool for Data Analysis and report creation on your local computer. It allows extensive data modelling and report design. Power BI Service is a cloud-based platform that facilitates collaboration and report sharing but has limited data modelling capabilities.
What Types of Visualisations can be Created in Power BI Desktop?

Power BI Desktop supports many visualisations, including area, bar, column, line, pie, doughnut charts, and more. It also offers advanced AI visuals like decomposition trees for multidimensional analysis and custom visuals available through Microsoft AppSource.
What are the Other Resources and Offers Provided by The Knowledge Academy?

The Knowledge Academy takes global learning to new heights, offering over 3,000 online courses across 490+ locations in 190+ countries. This expansive reach ensures accessibility and convenience for learners worldwide.
Alongside our diverse Online Course Catalogue, encompassing 19 major categories, we go the extra mile by providing a plethora of free educational Online Resources like News updates, Blogs, videos, webinars, and interview questions. Tailoring learning experiences further, professionals can maximise value with customisable Course Bundles of TKA.
What is the Knowledge Pass, and how Does it Work?

The Knowledge Academy’s Knowledge Pass, a prepaid voucher, adds another layer of flexibility, allowing course bookings over a 12-month period. Join us on a journey where education knows no bounds.
What are the Related Courses and Blogs Provided by The Knowledge Academy?

The Knowledge Academy offers various Business Intelligence Reporting Courses, including Tableau Desktop Training, Microsoft Power BI Course and DAX Course. These courses cater to different skill levels, providing comprehensive insights into Data Visualisation with Tableau.
Our Office Applications Blogs cover a range of topics related to Power BI Desktop offering valuable resources, best practices, and industry insights. Whether you are a beginner or looking to advance your knowledge on Data Visualisations, The Knowledge Academy's diverse courses and informative blogs have you covered.
Upcoming Office Applications Resources Batches & Dates
Date
 Querying Data with Microsoft Transact-SQL DP080
Thu 10th Apr 2025
Thu 12th Jun 2025
Thu 14th Aug 2025
Thu 9th Oct 2025
Thu 11th Dec 2025


 Top Rated Course


 If you wish to make any changes to your course, please


