We may not have the course you’re looking for. If you enquire or give us a call on +44 1344 203 999 and speak to our training experts, we may still be able to help with your training requirements.
We ensure quality, budget-alignment, and timely delivery by our expert instructors.

In our world where data rules, Data Analytics Tools are the superheroes. They swoop in to help organisations unlock the secrets hidden in vast oceans of data. Think of these tools as high-tech magnifying glasses that zoom in on the most important bits of information. They’re not just smart; they’re wise, helping businesses and curious minds make sense of numbers and trends.
In this blog you will learn more about Data Analytics Tools, including their significance, features, efficiency and use cases. We also discuss how they revolutionise decision-making processes across various industries. Learning about the potential of Data Analytics Tools will help you explore the hidden potential of your data and gain a competitive edge.
Table of contents
1) Introduction to Data Analytics Tools
2) Data Analytics Tools
a) Tableau
b) Microsoft Power BI
c) Python
d) R Programming
e) Google Analytics
3) Conclusion
Introduction to Data Analytics Tools
Data Analytics Tools offers several functionalities, catering to the ever-expanding data-driven landscape. These tools empower organisations to process, analyse, and visualise data and transform raw information into actionable insights. Some of the Data Visualisation tools that serve different purposes include:
a) Excel: A widely used tool for data manipulation, basic statistical analysis, and visualisation.
b) Tableau and Microsoft Power BI: These tools create intuitive dashboards
c) R Progamming: This is a statistical computation and graphical programming language.
d) SAS: This is a suite of software for advanced analytics, Business Intelligence, Data Management, and predictive analytics.
e) Python: Python is a renowned programming language that has plenty of libraries for in-depth Data Analysis and Machine Learning.
f) SQL: A programming language developed with the main objective of administering and allowing queries of relational databases relevant to data manipulation and mining.
g) Google Analytics: This web analytics tools provide invaluable data on user behaviour.
h) Apache Hadoop and Apache Spark: These are Big Data Analytics Tools that enable efficient processing of massive datasets.
Data Analytics Tools remain indispensable in many organisations, and the integration of AI and cutting-edge trends is shaping their evolution. These tools help in informed decision-making and driving competitive advantages across various industries.
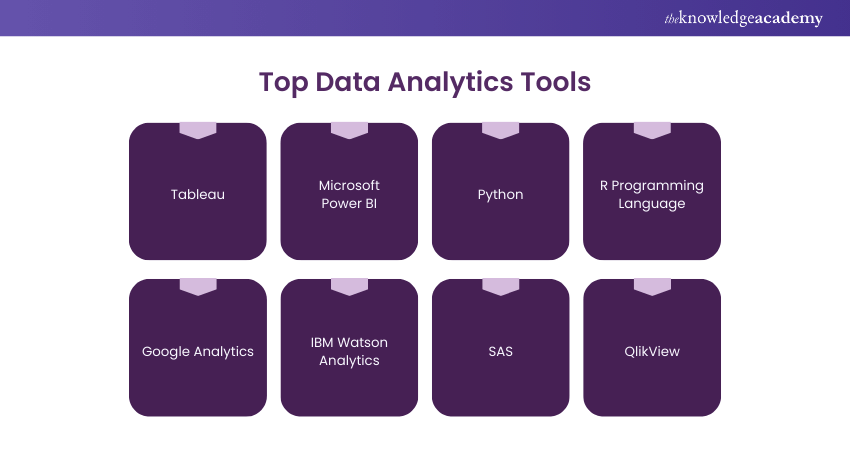
Top Data Analytics Tools
As you have learned about a few Data Analytics Tools, let's discuss some of them in detail. We have also explained a few other best Data Analytics Tools below:

1) Tableau
Tableau is a leader in Data Visualisation and Business Intelligence software that changes the way organisations connect with their data. It was founded in 2003 and has quickly become a favourite software product among Data Analysts, Business Users, and Data Enthusiasts. It has a user-friendly interface and dynamic features. It lets users connect different data sources, visualise real-time data, and give dynamic interactivity to dashboards to provide valuable insights for users.
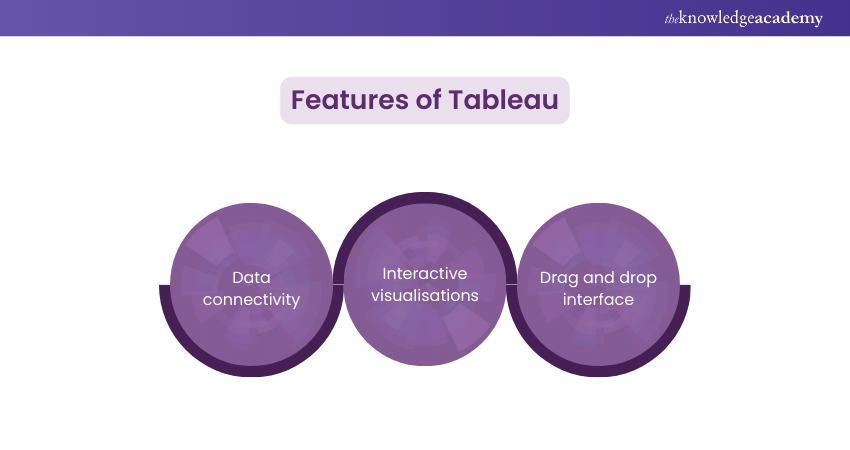
Features:

a) Data connectivity: Tableau has a variety of data sources at its disposal. It ranges from databases and spreadsheets to cloud services, which enables the smooth incorporation of data.
b) Interactive visualisations: Through this platform, we can create charts, graphs, and maps, among many others. We can easily manipulate the data and explore for a better understanding of trends in data.
c) Drag and drop interface: This means that Tableau has an interactive drag and drop interface, which allows its users to construct visualisations quickly without forcing them to delve into intricate coding.
Applications:
a) Business Intelligence: Tableau is used for extensive Business Intelligence, which helps facilitate enterprises with the required information needed for sales, marketing, and operations data.
b) Data exploration: Data Analysts use Tableau to explore and analyse data. They also uncover patterns, trends, and outliers for informed decision-making.
c) Reporting and dashboards: It is extensively utilised to make interactive and visually appealing dashboards and reports for stakeholders at various levels of the organisation.
Gain valuable skills in processing, analysing, and interpreting data. Sign up for Big Data and Analytics Training now!
2) Microsoft Power BI
Microsoft Power BI
This is a Business Analytics tool that was founded by Microsoft. Using this platform, users can convert complex data into useful visualisations and easy-to-read reports. This platform was officially released in 2015, and since then, it has become a favourite among organisations of all sizes. It is easy to use and can efficiently integrate with other Microsoft products and cloud capacity.
Features:
a) Natural language Querying: Power BI has a Natural Language Querying feature due to which a user can pose a question in plain language and get visualisation in a response instantly.
b) Data modelling and transformation: With the help of the Power Query and Power Pivot tools, users can process the modelling of data and transform its data quality and consistency.
c) Collaboration and sharing: Power BI provides the collaborative capacity among team members by sharing reports and dashboards through the cloud, resulting in data-based decision making.
Applications:
a) Business performance monitoring: Power BI is broadly utilised to stay up with the Key Performance Indicators (KPIs) and real time business performance tracking, allowing to discover patterns as well as possible problems in a timely manner.
b) Sales and marketing analytics: Businesses are relying on Power BI for analysing their sales performance, marketing campaigns, and customer reactions in making their marketing strategies and customer segmentation approaches more effective.
c) Financial analysis: Financial professionals use Power BI to build financial reports, budget analyses and forecasts which play a great role in financial decision-making process.
3) Python
Python is one of the renowned Programming Languages used worldwide for its simplicity and readability. In fact, it's open-source features, and ever-growing library of data made it widespread among Data Scientists, Researchers and Developers. Python’s flexibility and simplicity have resulted in its widespread implementation for Data Analysis tasks. Therefore, it can be applied in all industries without difficulty.
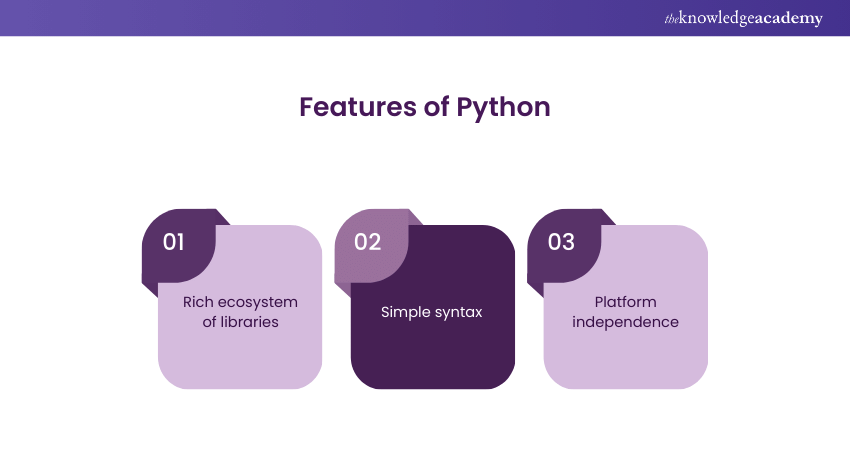
Features:

a) Rich ecosystem of libraries: Python has many libraries including Pandas, NumPy, SciPy, Matplotlib, etc. It offers high performance data processing and numerical computation, visualisation capabilities.
b) Simple syntax: Python syntax is simple, intuitive, and concise, which leads to less development time. These facts make it easy for both beginners and professional programmers to learn.
c) Platform independence: Python's ability to run on all the Operating System, like Linux, and Mac etc. makes the code written on one platform to be executed on another without any difficulty which enhances the portability of the code.
Applications:
a) Data wrangling and preprocessing: Python libraries like Pandas reduce the complexities of data cleaning, transformation, and preparation tasks. This makes the data ready for analysis.
b) Exploratory Data Analysis (EDA): Python simplifies EDA with Data Visualisation and determination of patterns, trends, and anomalies, expediting data-driven decision-making.
c) Machine Learning: Python's famous Machine Learning libraries such as Scikit-learn and TensorFlow allow developing of the framework for Machine Learning for predictive analytics and pattern recognition.
4) R Programming Language
R is a dynamic, open-source programming language for statistics and Data Analysis. Developed in the early 1990s, R has become a favourite among statisticians, Data Scientists, and researchers worldwide due to its substantial statistical functionality, Data Visualisation capabilities and active community support. Its flexibility and ease of extension through packages make it an indispensable tool for exploring, analysing, and visualising data in various fields.
Features:
a) Data manipulation: R's data manipulation packages, like dplyr, let users quickly clean, reshape, and transform data into a consistent format with data accuracy.
b) Community and collaboration: R derives its strength from an army of developers and statisticians who continually add something in the shape of packages, tutorials, and forums, stimulating sharing and knowledge-building.
c) Integration and interoperability: R can have perfect integration with the other Programming Languages such as Python and C++. It helps use the strength of various languages in a single Data Analysis process.
Applications:
a) Statistical analysis: R is equipped with numerous statistical functions, which makes it the ultimate tool for performing regression, hypothesis testing, and time-series analysis.
b) Data Visualisation: R has visualisation packages that allow users to design interactive and appealing plots. This helps users analyse exploratory data and generate insights.
c) Machine Learning: R's Machine Learning packages help users create and deploy a Machine Learning framework for classification, clustering, and prediction tasks.
5) Google Analytics
Google Analytics is a free web analytics resource offered by Google that gives valuable insights into website traffic and user behaviour. Launched in 2005, it has become the go-to tool for organisations, marketers, and website owners to track, analyse, and optimise their online presence.
Google Analytics empowers users to make the right data decisions, enhance user experiences, and improve overall website performance by offering a comprehensive suite of analytical tools.
Features:
a) Conversion tracking: Google Analytics enables businesses to track specific goals and conversions, such as form submissions and e-commerce transactions, and measure their marketing success.
b) Audience segmentation: Users can segment website traffic based on various parameters, like location, device type, and user behaviour, gaining valuable insights into different audience segments.
c) Customisation and integration: Google Analytics can be customised with custom dimensions, metrics, and event tracking, and it smoothly integrates with other Google products like Google Ads and Google Search Console.
Applications:
a) Website performance analysis: Google Analytics helps businesses analyse website traffic, identify popular pages, and understand user behaviour, enabling website optimisation and content improvements.
b) E-commerce analysis: E-commerce businesses leverage Google Analytics to track sales, conversion rates, and user engagement, optimising their online stores for higher revenue.
c) Digital marketing optimisation: Marketers use Google Analytics to estimate the effectiveness of marketing campaigns, identify successful channels, and allocate budgets more efficiently.
6) IBM Watson Analytics
IBM Watson Analytics is an advanced cloud-based Data Analysis platform developed by IBM. It leverages Artificial Intelligence (AI) and Machine Learning capabilities to enable users to find hidden patterns, insights, and trends in data without the need for complex programming or Data Science expertise.
Watson Analytics was launched in 2014. It has been widely adopted by businesses and data professionals seeking a user-friendly and powerful solution for data exploration and decision-making.
Features:
a) Smart data discovery: Watson Analytics uses AI to automatically analyse and identify relevant patterns in the data, making it easier for users to gain insights quickly.
b) Natural Language Processing (NLP): With NLP capabilities, users can interact with data using plain language, asking questions and receiving visualisations as responses.
c) Predictive analytics: Watson Analytics offers predictive modelling features, enabling users to forecast trends and outcomes and facilitating proactive decision-making.
Applications:
a) Financial planning and forecasting: The platform aids financial analysts in budgeting, financial modelling, and predicting financial outcomes.
b) Human resources analytics: Watson Analytics helps HR professionals analyse workforce data, identify employee trends, and optimise talent management strategies.
c) Healthcare and life sciences: Watson Analytics facilitates Data Analysis for medical research, patient outcomes, and disease management.
Master Spark MLlib, Spark GraphX, Spark Streaming and Spark SQL. Sign up for Apache Spark Training now!
7) SAS
SAS (Statistical Analysis System) is a dynamic software suite developed by SAS Institute Inc. It is renowned worldwide for its expertise in Advanced Analytics, Data Management, and Business Intelligence.
SAS was established in 1976 and has been a long-standing leader in the analytics industry. It provides Data Professionals, Statisticians, and Researchers with comprehensive Data Analysis and decision-making insights. SAS's various functions and industry-specific solutions have made it a top choice for organisations seeking to understand valuable insights from their data.
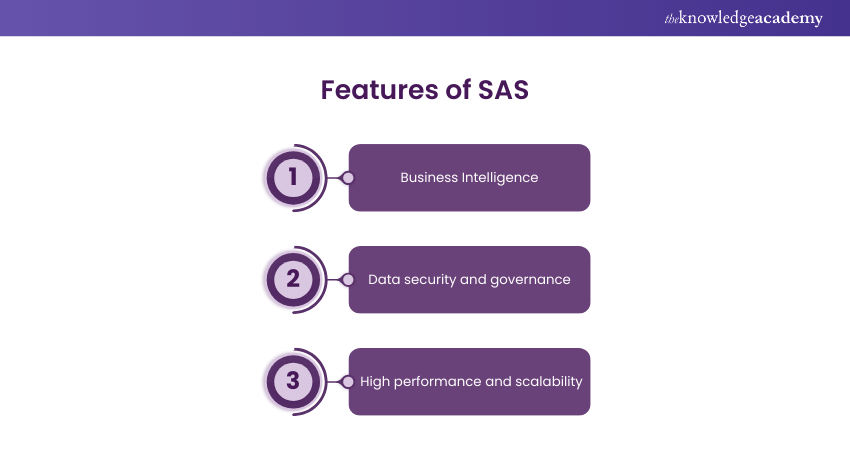
Features:

a) Business Intelligence: SAS has powerful reporting and visualisation tools. It allows users to create interactive dashboards and reports for data-driven decision-making.
b) Data security and governance: SAS prioritises data security and compliance, adhering to strict data governance and privacy standards.
c) High performance and scalability: SAS is designed to handle large-scale data processing and analysis, ensuring optimal performance and scalability.
Applications:
a) Financial services: SAS is widely used in the financial industry for risk assessment, fraud detection, and compliance reporting.
b) Healthcare and life sciences: In healthcare, SAS aids in clinical research, patient outcomes analysis, and personalised medicine.
c) Marketing and customer analytics: SAS assists businesses in customer segmentation, targeted marketing campaigns, and churn prediction.
8) QlikView
QlikView is a popular data discovery and visualisation tool developed by Qlik. It was launched in 1994, and since then, it revolutionised the way businesses interact with their data. It allows users to explore, analyse, and visualise data from various sources dynamically and interactively.
QlikView's associative data model lets seamless connections between data points, facilitating rapid insights and driving data-driven decision-making.
Features:
a) Associative data model: QlikView's unique associative data model lets users explore data without predefined paths, empowering them to navigate freely and discover new insights.
b) In-memory data processing: QlikView's in-memory technology accelerates data retrieval and analysis, providing real-time access to information.
c) Interactive dashboards: QlikView offers intuitive and user-friendly dashboards where users can interact with visualisations, making data exploration engaging and productive.
Applications:
a) Business Intelligence and reporting: QlikView is widely used for Business Intelligence and Reporting, enabling organisations to generate actionable insights from vast datasets.
b) Sales and revenue analysis: Sales teams leverage QlikView to analyse sales performance, identify opportunities, and optimise revenue strategies.
c) Supply chain and inventory management: QlikView aids in supply chain analysis, optimising inventory levels, and streamlining logistics processes.
Conclusion
Data Analytics Tools have become critical assets in organisations. Their ability to process and analyse vast volumes of data, coupled with intuitive visualisation, empowers data professionals to make informed decisions and get a competitive edge in today's dynamic business environment. We hope this blog has helped you get an idea about various Data Analytics Tools and how they can benefit your company.
Unlock the power of data with our Advanced Data Analytics Certification - sign up now!
Frequently Asked Questions

Popular Data Visualisation tools include Tableau for dynamic dashboards, Power BI for integration with Microsoft products, and Qlik for in-memory Data Processing. They help users interpret data trends and make informed decisions through visual representations.

When selecting Data Analytics tools, consider ease of use, scalability, compatibility with existing systems, cost, and community support. Choose tools that align with the data strategy of your organisation and the skill levels of potential users.

The Knowledge Academy takes global learning to new heights, offering over 30,000 online courses across 490+ locations in 220 countries. This expansive reach ensures accessibility and convenience for learners worldwide.
Alongside our diverse Online Course Catalogue, encompassing 17 major categories, we go the extra mile by providing a plethora of free educational Online Resources like News updates, Blogs, videos, webinars, and interview questions. Tailoring learning experiences further, professionals can maximise value with customisable Course Bundles of TKA.

The Knowledge Academy’s Knowledge Pass, a prepaid voucher, adds another layer of flexibility, allowing course bookings over a 12-month period. Join us on a journey where education knows no bounds.

The Knowledge Academy offers various Big Data and Analytics Training, including Data Science Analytics Course, Big Data Analysis Course and Big Data Architecture Training. These courses cater to different skill levels, providing comprehensive insights into What is Data?
Our Data, Analytics & AI Blog covers a range of topics offering valuable resources, best practices, and industry insights. Whether you are a beginner or looking to advance your Data Analytics skills, The Knowledge Academy's diverse courses and informative blogs have you covered.
Upcoming Data, Analytics & AI Resources Batches & Dates
Date
 Advanced Data Analytics Course
Mon 20th Jan 2025
Mon 19th May 2025
Mon 11th Aug 2025
Mon 13th Oct 2025
Mon 8th Dec 2025


 Top Rated Course


 If you wish to make any changes to your course, please


