


 Top Rated Course

We may not have the course you’re looking for. If you enquire or give us a call on +357 26030221 and speak to our training experts, we may still be able to help with your training requirements.
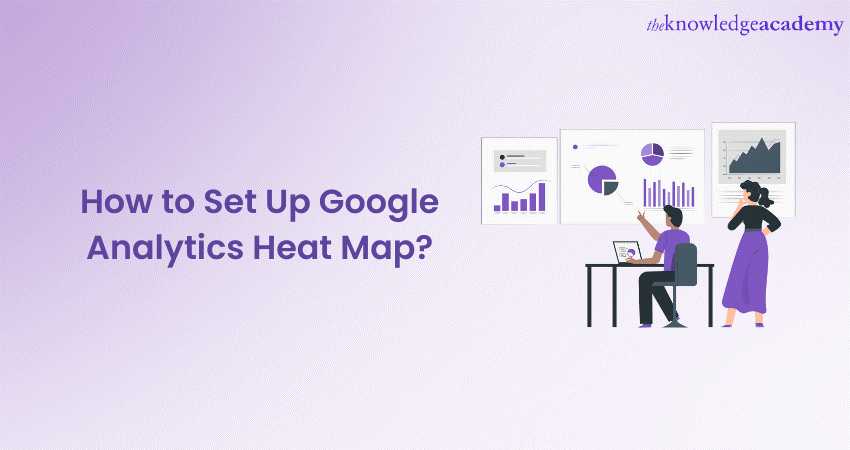
How to Set Up Google Analytics Heat Map? Explained In Detail
Eliza Taylor 03 January 2025Heat maps in Google Analytics refer to a colourful visual representation of data that helps website owners identify the best and worst areas of customer engagement. This blog is a detailed exploration of Google Analytics Heat Map, including its numerous benefits, best practices and categories. Read on to learn more!

Training Outcomes Within Your Budget!
We ensure quality, budget-alignment, and timely delivery by our expert instructors.
Table of Contents
Imagine having a canvas that vividly displays the state of your business website, showing exactly where your visitors are drawn, like footprints on a sandy beach. With Google Analytics Heat Maps, you don't have to imagine anymore! This powerful tool visually represents where visitors click, scroll, and interact on your pages, enabling you to make data-driven decisions to enhance the user experience.
In this blog, we'll walk you through the step-by-step process of setting up Google Analytics Heat Maps. We'll also highlight its benefits, best practices, and different types. So, dive in and discover how to craft the perfect heat map to illuminate your website's hidden performance!
Table of Contents
1) What is Google Analytics Heat Map?
2) How to set up Google Analytics Heat Map?
3) What are the Various Types of Heat Maps?
5) Exploring the Benefits of Google Analytics Heat Map
6) Best Practices for Google Analytics Heat Map
7) Conclusion
What is Google Analytics Heat Map?
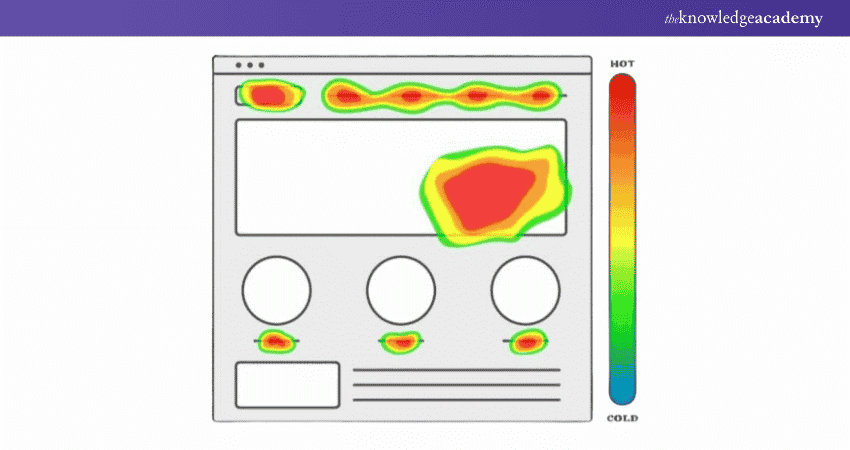
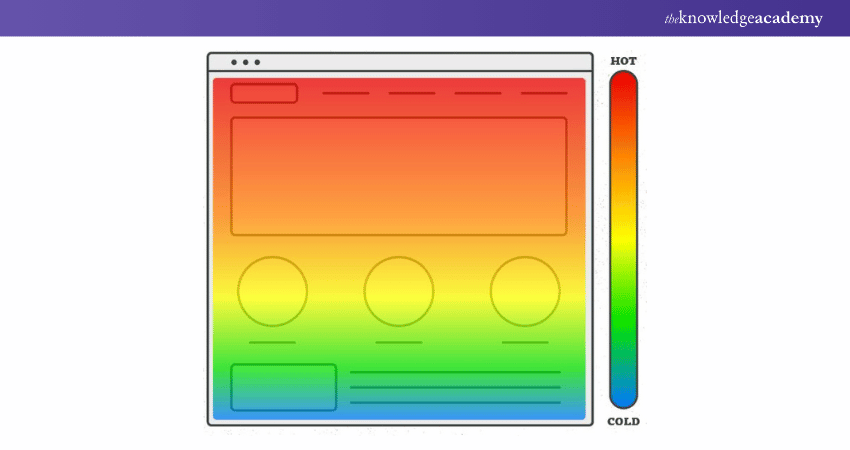
Google Analytics Heat Map is a dynamic and visual representation of user engagement on a website. It is an essential feature of Google Analytics that helps website owners and marketers gain valuable insights into user behaviour and interaction patterns.
Additionally, the Google Analytics Heat Map Tool displays the most and least clicked areas on a webpage, depicted using colour variations. The areas where users click the most are highlighted as "hotspots," while less interacted regions are referred to as "cold zones."
By tracking user clicks, movement, and scrolling behaviour, the "Google Analytics Heat Map" provides a clear understanding of how users navigate and engage with a website's content. It offers invaluable data to website administrators, enabling them to identify which elements attract the most attention and which ones require improvement.
This data-driven visual representation helps website owners optimise their websites for improved User Experiences (UX) and better conversion rates. By leveraging the insights from the Google Analytics Heat Map, businesses can strategically place important buttons, links, and call-to-action elements, thereby enhancing website usability and driving user interactions.
How to set up Google Analytics Heat Map?
If you want to gain insights into how users interact with your website, Google's Heatmaps can be a handy tool. By following these three easy steps, you can start tracking your website data and analysing user behaviour to improve your website's performance.
a) Install Chrome extension: To enable the use of Heatmap features on Google Analytics, you need to first navigate to the Chrome Extension store, locate the Page Analytics Chrome Extension (By Google), and install the Google Analytics Heat Map Extension. This extension is necessary to generate visual representations of website activity, allowing you to view data in a more intuitive and meaningful way.
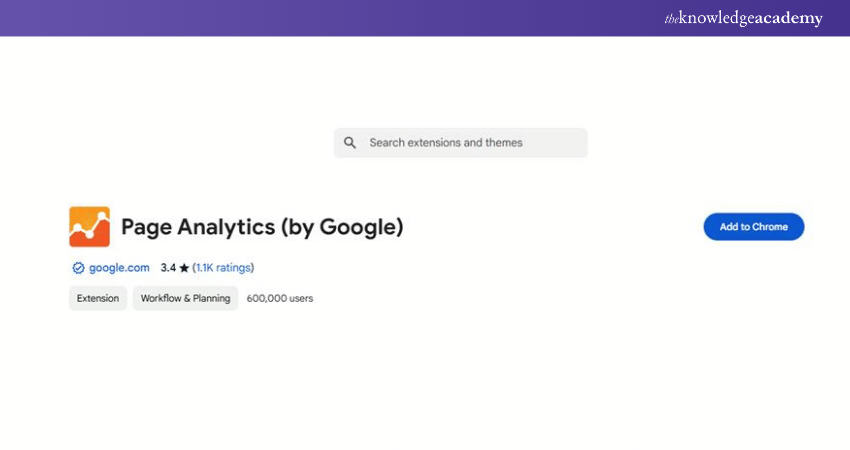
b) Activate the Chrome Extension: After installing Google Heat Map, access your website and click on the Page Analytics app located at the top of your Chrome browser. If the installation was successful, the app should indicate so. Please note that in order to utilise Google Heat Map, you must have an account and have Analytics code installed on your website beforehand. These are necessary prerequisites for using this tool.
c) Analyse Your Website with Google Analytics Heat Map: To utilise the Heatmap feature on your website, click on the icon, and it will show the percentage of clicks each element on your site receives. Along with this, you will have access to other valuable Google Analytics data, including time spent on each page, bounce rates, number of visits, and more. This feature will enable you to gather insightful information on how your website is being interacted with, allowing you to make informed decisions on how to optimise its performance.
Learn to tailor your knowledge to monitor websites efficiently, by signing up for the Google Analytics Certification now!
What are the Various Types of Heat Maps?
Here are the various types of Heat Maps described as follows:
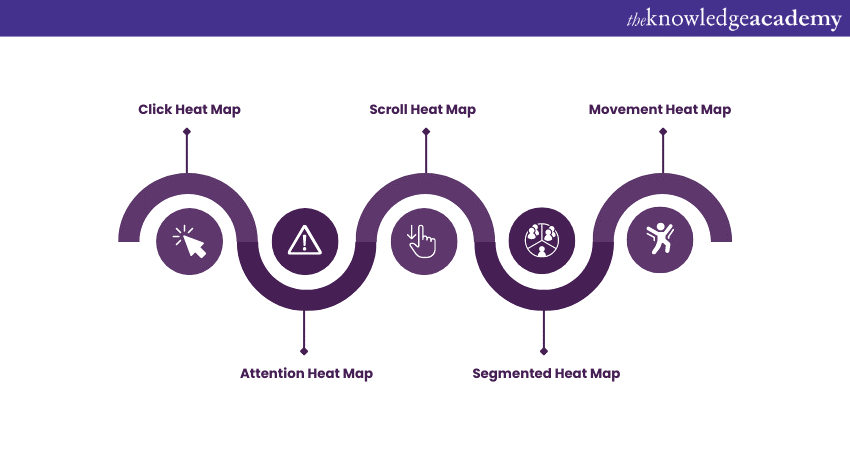
a) Click Heat Map: Click Heat Maps track and display user clicks on a webpage. By using colour variations to represent the frequency of clicks, these maps highlight areas that attract the most user attention, indicating popular and interactive elements. Website owners can analyse Click Heat Maps to optimise their call-to-action buttons, links, and other clickable elements for higher engagement and improved conversion rates.
b) Scroll Heat Map: Scroll Heat Maps provide insights into user scrolling behaviour on a webpage. These maps provide insight into how far users scroll down a page and reveal drop-off points where users lose interest. By identifying the sections with the most significant drop-off, businesses can adjust their content length, placement of key information, and calls-to-action to maintain user engagement throughout the entire page.
c) Movement Heat Map: Movement Heat Maps track and display the movement of the user's cursor across the webpage. These maps help identify areas of interest or confusion by showing where users hover their cursors the most.
d) Attention Heat Map: Attention Heat Maps combine data from click, scroll, and movement heat maps to provide deliver a comprehensive view of user attention on a webpage. By analysing this map, businesses can gain valuable insights into which elements receive the most attention from users.
e) Segmented Heat Map: Segmented Heat Maps allow website owners to analyse user interactions based on specific segments, such as traffic sources, device types, or user demographics. This type of Heat Map helps businesses understand how different user groups interact with their website, enabling targeted optimisations for each segment to enhance their experiences and boost conversions.
Acquire the knowledge about the critical aspects of Web Analytics, by signing up for the Web Analytics Course now!
Exploring the Benefits of Google Analytics Heat Map
Here are the various benefits of Google Analytics Heat Map discussed in detail:
a) Visualising User Engagement: One of the primary benefits of Google Analytics Heat Map is its ability to visually represent user engagement on a website. Through intuitive colour-coded visuals, website owners can quickly identify which areas attract the most attention and which ones receive less interaction.
This visual representation helps businesses understand user behaviour at a glance, making it easier to optimise their websites for improved User Experiences(UX).
b) Identifying High-performing Content: Heat Maps provide invaluable insights into the performance of different website elements, such as buttons, links, and images. By identifying the "hotspots" with the highest user interactions, businesses can pinpoint the most successful content and replicate it across other parts of their website.
c) Uncovering Usability Issues: Heat Maps play a crucial role in uncovering usability issues on a website. By highlighting "cold zones" where users show little to no interaction, businesses can identify potential problems with navigation, layout, or call-to-action elements.
Addressing these issues can significantly enhance User Experiences (UX), reduce bounce rates, and increase overall website effectiveness.
d) Optimising Website Layout and Design: Understanding user behaviour through Heat Maps allows businesses to optimise their website's layout and design effectively. By strategically placing important elements in the high-activity areas, such as popular buttons or crucial information, website owners can guide users towards desired actions and goals.
e) Data-driven Decision Making: Google Analytics Heat Map empowers businesses to make data-driven decisions. Instead of relying on assumptions or guesswork, website owners can base their optimisation strategies on real user interactions. This ensures that website modifications align with user preferences and are more likely to yield positive results with regards to conversions and user engagement.
Master the skills to optimise strategies using SEO, Social Media, and content tools in our up-to-date Digital Marketing Tools Training - Sign up now!
Best Practices for Google Analytics Heat Map
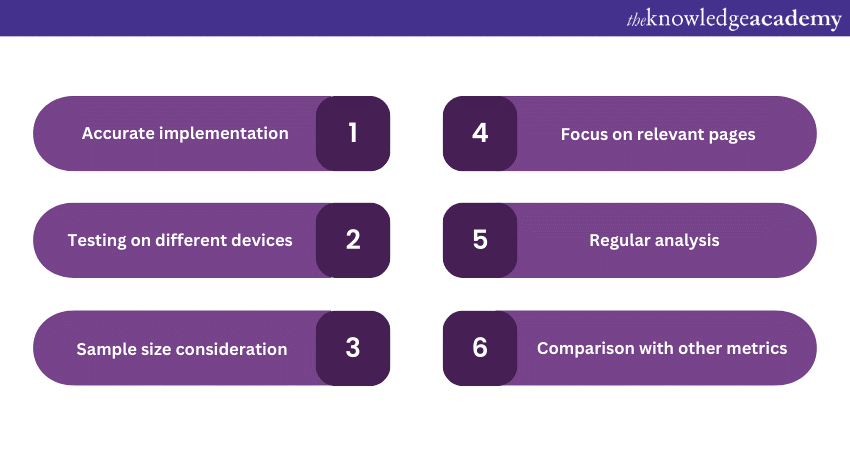
a) Accurate Implementation: When analysing heat map data, consider the sample size. Accurate data collection is essential to get meaningful insights into user behaviour.
b) Testing on Different Devices: Test the Heat Map on various devices, including desktops, laptops, tablets, and smartphones. Different devices may exhibit different user behaviours, and testing ensures accurate representation.
c) Sample Size Consideration: Consider the sample size when analysing Heat Map data. Large sample sizes provide more reliable insights, so allow enough time to gather sufficient data.
d) Focus on Relevant Pages: Focus on Heat Maps for crucial pages that drive conversions, such as landing pages and checkout processes. This ensures that optimisation efforts are directed towards areas with a significant impact on results.
e) Regular Analysis: Regularly analyse Heat Map data to identify distinct patterns and trends in user behaviour. Continuous monitoring helps in making timely adjustments to improve user experiences.
f) Comparison With Other Metrics: Compare Heat Map data with other metrics like bounce rate, session duration, and conversion rates. Correlations can reveal insights into how user behaviour affects these metrics.
g) Privacy and Consent: Comply with privacy regulations and obtain user consent for data collection through Heat Maps. Ensure that sensitive information is not tracked or displayed in the Heat Maps.
h) A/B Testing with Heat Maps: Integrate Heat Maps with A/B testing to compare the performance of different design variations. A/B testing using Heat Maps provides data-driven insights for website optimisation.
i) Collaboration and Communication: Encourage collaboration between different teams, such as marketing, design, and development, to leverage Heat Map insights effectively. Clear communication ensures that everyone understands and acts upon the findings.
j) Actionable Recommendations: Transform Heat Map data into actionable recommendations. Use the insights to make improvements to website layout, design, and content to enhance user engagement and conversions.
k) Consider Mobile Users: As mobile usage continues to rise, pay special attention to heat maps for mobile users. Optimise the mobile experience based on Heat Map insights to cater to this significant user segment.
l) Long-term Analysis: Consider long-term Heat Map analysis to understand user behaviour changes over time. Long-term trends help identify evolving user preferences and inform website adjustments accordingly.
Conclusion
To sum it up, Google Analytics Heat Maps are a fantastic tool for understanding how visitors interact with your website. By setting up your own heat maps, you can gain valuable insights and make informed decisions to improve the User Experience. Follow the steps in this blog, apply the best practices, and start uncovering your website's hidden performance today. Your business will thank you for it!
Acquire the knowledge to engage in a fruitful marketing process by signing up for the Digital Marketing Course now!
Frequently Asked Questions
What is the Difference Between a Heat Map and Traditional Google Analytics Reports?

A Heat Map shows where users click, scroll, or hover on a webpage, providing insights into user behaviour in a graphical format. On the other hand, a traditional Google Analytics report offers data in numerical and tabular formats, focusing on metrics such as page views, session duration, and user demographics.
What are the Best Tools for Creating Heat Maps Using Google Analytics?
Some of the best tools for creating heat maps in Google Analytics are:
a) Smartlook
b) Crazy Egg
c) Hotjar
d) Lucky Orange
e) Mouseflow
f) Inspectlet
g) Microsoft Clarity
What are the Other Resources and Offers Provided by The Knowledge Academy?
The Knowledge Academy takes global learning to new heights, offering over 30,000 online courses across 490+ locations in 220 countries. This expansive reach ensures accessibility and convenience for learners worldwide.
Alongside our diverse Online Course Catalogue, encompassing 19 major categories, we go the extra mile by providing a plethora of free educational Online Resources like News updates, Blogs, videos, webinars, and interview questions. Tailoring learning experiences further, professionals can maximise value with customisable Course Bundles of TKA.
What is The Knowledge Pass, and How Does it Work?
The Knowledge Academy’s Knowledge Pass, a prepaid voucher, adds another layer of flexibility, allowing course bookings over a 12-month period. Join us on a journey where education knows no bounds.
What are the Related Courses and Blogs Provided by The Knowledge Academy?
The Knowledge Academy offers various Digital Marketing Courses, including the Certified Artificial Intelligence (AI) for Digital Marketing Training and the Digital Marketing Tools Training. These courses cater to different skill levels, providing comprehensive insights into What is Customer Insights.
Our Digital Marketing Blogs cover a range of topics related to Google Analytics, offering valuable resources, best practices, and industry insights. Whether you are a beginner or looking to advance your Digital Marketing skills, The Knowledge Academy's diverse courses and informative blogs have got you covered.
Upcoming Digital Marketing Resources Batches & Dates
Date
 Digital Marketing Course
Digital Marketing Course
Fri 24th Jan 2025
Digital Marketing Course
Fri 28th Mar 2025
Digital Marketing Course
Fri 23rd May 2025
Digital Marketing Course
Fri 25th Jul 2025
Digital Marketing Course
Fri 26th Sep 2025
Digital Marketing Course
Fri 28th Nov 2025
 If you wish to make any changes to your course, please


