We may not have the course you’re looking for. If you enquire or give us a call on +358 942454206 and speak to our training experts, we may still be able to help with your training requirements.
Training Outcomes Within Your Budget!
We ensure quality, budget-alignment, and timely delivery by our expert instructors.

Imagine turning uncertainty into clarity and guesswork into confidence. That's the magic of Hypothesis Testing - a tool that transforms questions into answers and hunches into proven facts. Whether it's uncovering consumer behaviour secrets or determining the effectiveness of medical treatment, this testing helps you make decisions you can trust.
How often do we make assumptions without proof? Is that new teaching method effective, or is it just wishful thinking? Hypothesis Testing challenges you to dive deeper, ask smarter questions, and let the data speak. It's not just about numbers; it's about discovering insights that shape the future. In this blog, let's explore how this testing can change the way you think, decide, and innovate.
Table of Contents
1) What is Hypothesis Testing in Statistics?
2) The Significance of Hypothesis Testing in Data Analysis
3) Types of Hypothesis Testing
4) Key Steps in Hypothesis Testing
5) Conclusion
What is Hypothesis Testing in Statistics?
Hypothesis Testing is a way to check if a claim about a group is true by using data from a sample. Researchers start with a null hypothesis (the default idea) and an alternative hypothesis, then look at the data to decide if the original claim is likely true or false.
By applying rigorous mathematical techniques, this approach allows scientists, businesses, and researchers to make informed decisions with a specified level of confidence, transforming speculative assumptions into evidence-based conclusions across various fields like medicine, market research, and scientific studies.
History of Hypothesis Testing
Early 20th Century Origin: The concept of Hypothesis Testing emerged in the early 1900s with foundational contributions from statisticians.
Sir Ronald A. Fisher (1920s):
a) Introduced the method of significance testing.
b) Established foundational principles for modern statistical tests.
Neyman and Pearson Contributions:
a) Developed the concepts of Type I (false positive) and Type II (false negative) errors.
b) Enhanced the practical application of Hypothesis Testing.
Expansion Across Disciplines:
a) Widely adopted in fields such as economics, medicine, and social sciences.
b) Integral to validating scientific research.
Modern-day Applications:
a) Crucial for data analysis and interpretation.
b) Guides critical decision-making processes in both academic and business contexts.
The Significance of Hypothesis Testing in Data Analysis
Hypothesis Testing is crucial for making informed, data-driven decisions. Here’s why:
1) Avoiding Misleading Conclusions
It helps prevent incorrect conclusions, such as a Type I error (wrongly assuming a product will succeed) or a Type II error (overlooking a successful product). Proper significance levels and p-values reduce these risks, ensuring more accurate results.
2) Making Smarter Decisions
By relying on data, Hypothesis Testing removes guesswork. For example, city planners can test whether a new park increases community engagement, and teachers can assess if a new teaching method improves performance.
3) Optimising Business Strategies
In business, Hypothesis Testing helps evaluate strategies like free shipping offers before full implementation, reducing the risk of costly mistakes and ensuring decisions are based on solid data.
Types of Hypothesis Testing
The following are the different types of Hypothesis Testing:
1) z-test
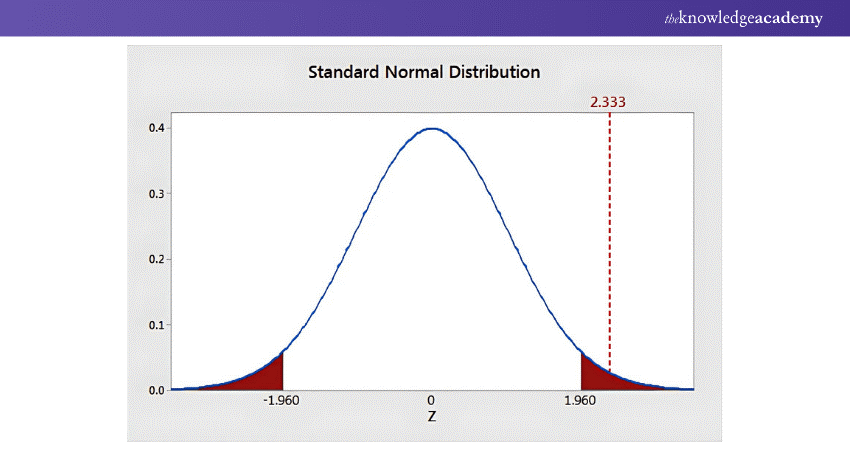
A t-test compares two group means to determine if their differences are statistically significant, helping researchers understand whether observed variations are meaningful or likely due to random chance.
2) t-test
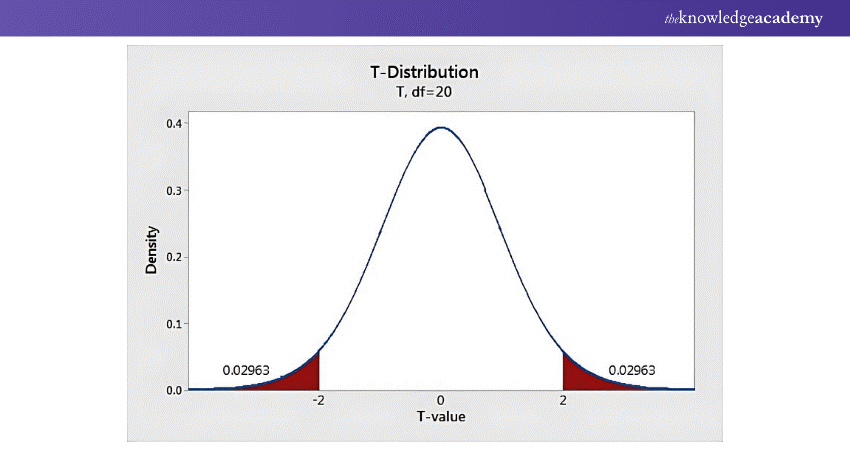
A t-test is used to evaluate whether there is a significant difference between the average values of two groups and assess if they differ significantly. It is commonly used to evaluate the impact of a procedure or treatment on a population, helping to determine whether observed differences are meaningful.
3) Chi-square Test
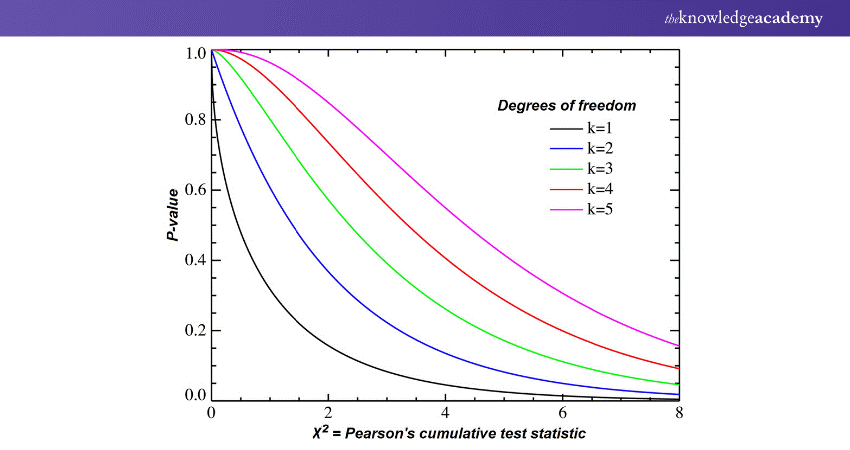
A Chi-square test compares actual data to expected outcomes. It helps researchers determine if observed differences in categorical variables are statistically significant or likely due to random chance.
4) ANOVA
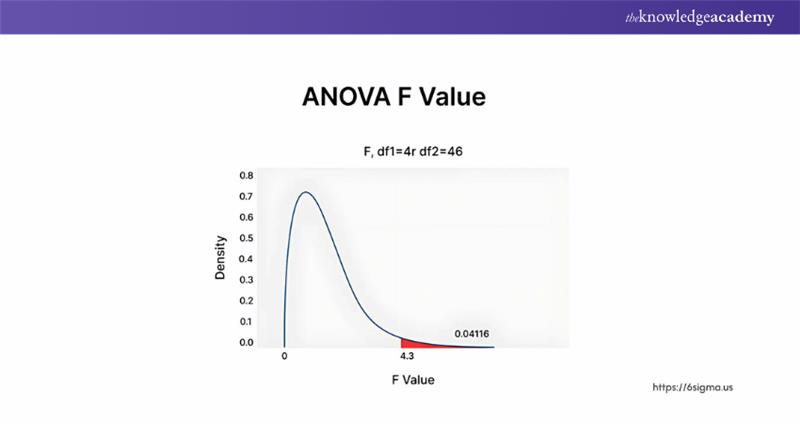
ANOVA is a statistical tool that compares multiple groups to determine if their differences are meaningful or just random. It helps researchers understand if variations across groups are significant, like testing if different teaching methods truly impact student performance.
Master Statistical Process Control Course to improve quality, reduce variability, and drive data-driven business success today!
Key Steps in Hypothesis Testing
Let’s break down the important steps involved in Hypothesis Testing. These steps will guide you through the process, ensuring you can test your hypotheses with confidence and accuracy:
Step 1: State the Hypotheses
a) Null Hypothesis (H₀): This represents the default assumption or the statement to be tested. It usually suggests that there is no effect or no difference.
b) Alternative Hypothesis (H₁ or Ha): This represents the researcher's belief or the hypothesis to be proven. It indicates that there is a significant effect or difference.
Step 2: Choose the Significance Level (α)
Choose how much error you're willing to accept. Typically, researchers set this at 5%, meaning they're okay with a small chance of drawing a wrong conclusion.
Step 3: Select the Appropriate Test
Select a statistical test that matches your data type. Think of this like choosing the right tool for a specific job - you wouldn't use a hammer to screw in a bolt.
Step 4: Collect and Analyse Data
Collect your sample data and run the appropriate statistical test. Calculate key numbers that help you understand your results.
Step 5: Make a Decision
Compare the p-value to the selected significance level (α):
a) If p-value ≤ α, reject the null hypothesis (suggesting that the results are statistically significant).
b) If p-value > α, fail to reject the null hypothesis (suggesting that the results are not statistically significant).
Step 6: Interpret the Results
Based on the decision, interpret the results in the context of the research question. If the null hypothesis is invalidated, it implies evidence in favour of the alternative hypothesis. If it is not rejected, there is insufficient evidence to support the alternative hypothesis.
Step 7: Report the Findings
Clearly communicate the results, including the test statistic, p-value, and any conclusions. It is important to explain the findings in a way that is understandable to the intended audience.
Leverage statistical analysis's potential to improve your decision-making skills with an expert Statistics Course – join now!
Conclusion
Hypothesis Testing is a powerful tool for data-driven decisions, ensuring choices are guided by evidence, not guesswork. From healthcare to marketing, mastering this process empowers you to draw meaningful, reliable insights from data. Embrace its potential to turn uncertainties into opportunities and questions into confident answers!
Boost your career with an expert-led Business Analyst Course - gain skills, insights, and certification today!
Frequently Asked Questions

The p-value is a range that suggests how it's easier to get intense effects as what we located if the null speculation is authentic. A smaller p-value means there may be more potent proof towards the null hypothesis.

The t-test is a method used to check if the averages (means) of two groups are meaningfully different. It's especially useful when dealing with small samples or when we don’t know the standard deviation of the population.

The Knowledge Academy takes global learning to new heights, offering over 30,000 online courses across 490+ locations in 220 countries. This expansive reach ensures accessibility and convenience for learners worldwide.
Alongside our diverse Online Course Catalogue, encompassing 19 major categories, we go the extra mile by providing a plethora of free educational Online Resources like News updates, Blogs, videos, webinars, and interview questions. Tailoring learning experiences further, professionals can maximise value with customisable Course Bundles of TKA.

The Knowledge Academy’s Knowledge Pass, a prepaid voucher, adds another layer of flexibility, allowing course bookings over a 12-month period. Join us on a journey where education knows no bounds.

The Knowledge Academy offers various Business Analyst Course, including Statistics Course, Statistical Process Control Training and Mathematical Optimisation for Business Problems. These courses cater to different skill levels, providing comprehensive insights into Statistical Process Control.
Our Business Analysis Blogs cover a range of topics related to Statistics, offering valuable resources, best practices, and industry insights. Whether you are a beginner or looking to advance your Business Analysis skills, The Knowledge Academy's diverse courses and informative blogs have got you covered.
Upcoming Data, Analytics & AI Resources Batches & Dates
Date
 Statistics Course
Fri 20th Dec 2024
Fri 21st Feb 2025
Fri 25th Apr 2025
Fri 20th Jun 2025
Fri 22nd Aug 2025
Fri 17th Oct 2025
Fri 19th Dec 2025


 Top Rated Course


 If you wish to make any changes to your course, please


