We may not have the course you’re looking for. If you enquire or give us a call on 0800 446148 and speak to our training experts, we may still be able to help with your training requirements.
Training Outcomes Within Your Budget!
We ensure quality, budget-alignment, and timely delivery by our expert instructors.

Extracting meaningful insights from Big Data is a competitive advantage that businesses and organisations can't afford to ignore. In such a scenario, Big Data Patterns, which reveal hidden correlations and trends within vast datasets, hold the potential to drive informed decision-making and innovation.
However, uncovering these Patterns can be a daunting task without the right approach. But you need not worry more. In this Big Data Patterns blog, you will learn the 3 simple steps to find Big Data Patterns. You will also explore the importance of understanding these patterns. Read more!
Table of Contents
1) What are Big Data Patterns?
2) Steps to Find Patterns in Big Data
a) Step 1: Organising the Data
b) Step 2: Choosing the Right Tools and Algorithms
c) Step 3: Exploratory and Advanced Data Analysis
3) Conclusion
What are Big Data Patterns?
Big Data Patterns are recurring, and significant trends or relationships discovered within vast datasets. These Patterns can take various forms, such as correlations, anomalies, clusters, or sequences. They reveal valuable insights and information. Detecting Big Data Patterns enables businesses and analysts to achieve the following:
a) Make data-driven decisions
b) Predict future outcomes
c) Identify outliers or anomalies
d) Understand customer behaviour or market trends
Big Data Patterns play a crucial role in fields like Data Analytics, Machine Learning, and Artificial Intelligence. As a result, they facilitate the extraction of actionable knowledge from the immense volume, velocity, and variety of data generated in today's digital age.
Steps to Find Patterns in Big Data

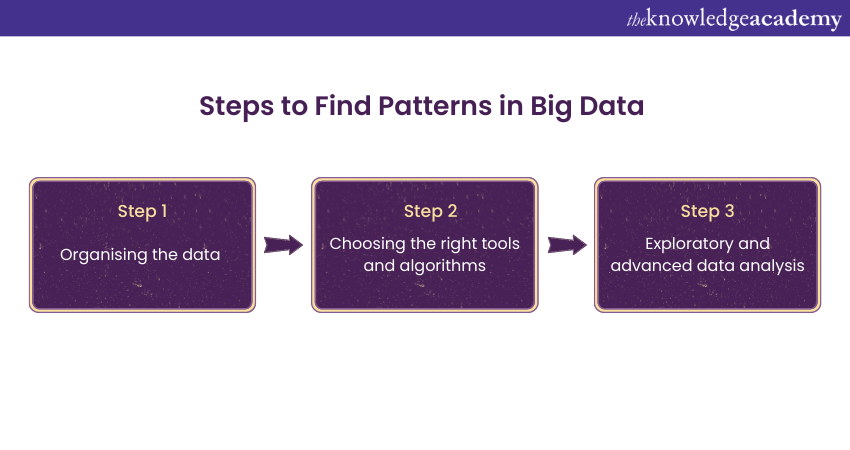
Finding Patterns in Big Data involves the following three basic steps:
Step 1: Organising the Data
The journey to discovering meaningful Patterns in Big Data begins with effective data preparation. This step is often underestimated but is crucial for the success of your analysis. Here's what you need to do:
a) Data Collection and Integration: Gather data from various sources, both structured and unstructured. Ensure that data is stored in a central location for easy access and analysis.
b) Data Cleaning: Before you can identify Big Data Patterns, your data must be clean and error-free. Remove duplicates, handle missing values, and correct inaccuracies in your dataset.
c) Data Transformation: Transform data into a suitable format for analysis. This may involve scaling, normalising, or aggregating variables to ensure consistency and relevance.
d) Feature engineering: Create new features or variables that can enhance your analysis. This step often requires domain knowledge and creativity.
e) Data sampling: For exceptionally large datasets, consider using data sampling techniques to work with manageable subsets during initial exploration.
f) Data Splitting: Divide your dataset into training and testing sets to evaluate the model's performance later in the analysis process.
Unlock the power of data with our Big Data and Analytics Training – Register today to transform your career!
Step 2: Choosing the Right Tools and Algorithms
A plethora of tools and algorithms are at your disposal when it comes to Big Data analysis. Each of these tools and algorithms possesses its unique set of strengths and weaknesses. The crux lies in selecting the ones that align best with your specific dataset and the patterns you aim to unearth. Here are some commonly employed tools for Big Data analysis, each catering to distinct aspects:
a) Apache Spark: Apache Spark stands as a unified analytics engine renowned for large-scale data processing. Its versatility extends to Machine Learning, Graph Processing, and Stream Processing, making it an invaluable choice for multiple tasks.
b) Apache Hadoop: Serving as a distributed file system, Apache Hadoop excels in both storing and processing extensive datasets. Thus, this tool becomes a cornerstone for Big Data applications.
c) Hive: Built upon the foundation of Apache Hadoop, this tool provides a user-friendly SQL-like interface. It empowers users to query and analyse data stored within the Hadoop ecosystem with ease.
d) Pig: Pig offers a high-level data processing language specifically tailored for Apache Hadoop. This language simplifies the creation of MapReduce programs, freeing users from the need to delve into Java programming intricacies.
Big Data analysis also involves a rich assortment of algorithms, each tailored to distinct analytical needs. These algorithms include the following:
a) Machine Learning Algorithms: Machine Learning algorithms shine in training models for predictive analytics and data classification tasks. They facilitate data-driven decision-making.
b) Graph Processing Algorithms: These algorithms excel in analysing vast graph datasets, unravelling trends and patterns within intricate network structures.
c) Stream Processing Algorithms: Designed for real-time analytics, Stream Processing algorithms dissect data as it's generated. As a result, they provide instant insights into dynamic data streams.
Selecting the appropriate tools and algorithms is a pivotal step in the data analysis process. The effectiveness of your analysis heavily depends on the tools you employ and the algorithms you apply. Tool selection can be based on the following factors:
a) Data Compatibility: Ensure chosen tools align with your data's format and complexity.
b) Analytical Goals: Define your objectives to guide tool and algorithm selection.
c) Scalability: Assess if the tools selected by you can handle your data volume, especially for Big Data.
d) Specialised Domains: Consider specialised tools for specific domains like Natural Language Processing (NLP) or Geospatial analysis.
Ethical Considerations and Interpretability: Account for ethical concerns and interpretability of results in your choices.
Acquire the basic knowledge of Data Analytics by signing up for our Data Analytics for Marketing Professional Course now!
Step 3: Exploratory and Advanced Data Analysis

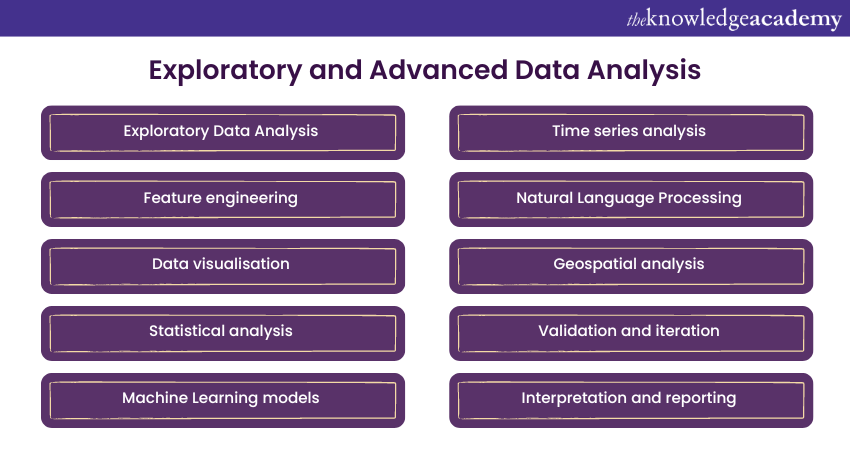
Once you've collected and prepared your data and chosen the right tools and algorithms, it's time to embark on the crucial phases of exploratory and advanced data analysis. As the third step of uncovering Big Data Patterns, this step involves delving deeper into your dataset, uncovering patterns, drawing insights, and making data-driven decisions. Here's how to navigate this phase effectively:
a) Exploratory Data Analysis (EDA): Begin by exploring the fundamental characteristics of your data. Calculate summary statistics, create visualisations, and examine data distributions. EDA helps you understand the structure of your dataset, identify outliers, and reveal initial trends and correlations.
b) Feature Engineering: In advanced analysis, feature engineering plays a critical role. It involves creating new features or variables derived from existing data to improve model performance. Domain knowledge is often required to engineer meaningful features.
c) Data Visualisation: Visualisations are powerful tools for data exploration. Create charts, graphs, and plots to represent data relationships visually. Visualisations aid in identifying clusters, trends, and anomalies within the dataset.
d) Statistical Analysis: Apply statistical tests and techniques to validate hypotheses and uncover relationships between variables. Techniques like regression analysis, hypothesis testing, and correlation analysis help in this regard.
e) Machine Learning (ML) Models: Utilise Machine Learning models to gain deeper insights. Apply clustering algorithms to identify groups within your data or use classification and regression models for prediction and Pattern recognition.
f) Time Series Analysis: For time-dependent data, time series analysis techniques can reveal temporal patterns and trends. This is essential for forecasting and anomaly detection.
g) Natural Language Processing (NLP): If your data includes textual information, employ NLP techniques to extract sentiments, topics, or entities. NLP enhances the understanding of unstructured text data.
h) Geospatial Analysis: For location-based data, Geospatial analysis allows you to uncover spatial patterns and relationships. This is valuable in fields such as urban planning, logistics, and epidemiology.
i) Validation and Iteration: Continuously validate your analysis results. Use cross-validation techniques to assess model performance and iterate through different approaches until you obtain reliable and meaningful insights.
j) Interpretation and Reporting: Finally, interpret your findings and report them effectively. Ensure that your insights are communicated clearly and consider the implications for decision-making and future actions.
Conclusion
Finding meaningful Patterns is a game-changer for businesses and organisations. By following the above-mentioned 3 simple steps to find Big Data Patterns, they can unlock the hidden insights within Big Data. Remember that finding these Patterns is an iterative process, so continue refining your approach to extract valuable insights effectively.
Learn to evaluate risk and predict outcomes based on data by signing up for our Predictive Analytics Training now!
Frequently Asked Questions

The four types of data emerging patterns are:
a) Clustering Patterns: Group similar data points together.
b) Sequential Patterns: Identify sequences and trends over time.
c) Associative Patterns: Find relationships between variables.
d) Outlier Patterns: Detect anomalies and deviations from the norm.

To find patterns in big data:
1) Data Preprocessing: Clean and transform data.
2) Data Mining Techniques: Use algorithms like clustering, classification, and association.
3) Visualisation Tools: Employ graphs and charts to identify trends.
4) Machine Learning Models: Apply supervised and unsupervised learning techniques.

The Knowledge Academy takes global learning to new heights, offering over 30,000 online courses across 490+ locations in 220 countries. This expansive reach ensures accessibility and convenience for learners worldwide.
Alongside our diverse Online Course Catalogue, encompassing 17 major categories, we go the extra mile by providing a plethora of free educational Online Resources like News updates, Blogs, videos, webinars, and interview questions. Tailoring learning experiences further, professionals can maximise value with customisable Course Bundles of TKA.

The Knowledge Academy’s Knowledge Pass, a prepaid voucher, adds another layer of flexibility, allowing course bookings over a 12-month period. Join us on a journey where education knows no bounds.

The Knowledge Academy offers various Big Data & Analytics Courses, including Hadoop Big Data Certification Training, Apache Spark Training and Big Data Analytics & Data Science Integration Course. These courses cater to different skill levels, providing comprehensive insights into Key Characteristics of Big Data.
Our Data, Analytics & AI Blogs cover a range of topics related to Data Analytics, offering valuable resources, best practices, and industry insights. Whether you are a beginner or looking to advance your Data Analytics and Machine Learning skills, The Knowledge Academy's diverse courses and informative blogs have got you covered.
Upcoming Data, Analytics & AI Resources Batches & Dates
Date
 Data Science Analytics
Fri 10th Jan 2025
Fri 28th Feb 2025
Fri 4th Apr 2025
Fri 16th May 2025
Fri 11th Jul 2025
Fri 19th Sep 2025
Fri 21st Nov 2025


 Top Rated Course


 If you wish to make any changes to your course, please


