We may not have the course you’re looking for. If you enquire or give us a call on +44 1344 203 999 and speak to our training experts, we may still be able to help with your training requirements.
We ensure quality, budget-alignment, and timely delivery by our expert instructors.

In this blog, we'll look at Excel for Finance, providing you with the skills and strategies to navigate the financial landscape effectively. Whether you're a skilled finance professional or an aspiring analyst, this blog will have everything to get your doubts covered. Let's dive into the fundamentals to navigate through the paradigm of MS Excel in your financial endeavours. This launcher for Excel for Finance is all you require, along with essential tips and techniques to kickstart your financial analysis and reporting. So, get ready to embark on this enlightening journey and unlock Excel's vast possibilities for the financial domain.
Table of Contents
1) What is Microsoft Excel?
2) Importance of Excel for Finance
3) Key Excel functions for Finance
4) The Appeal of Excel for Finance Teams
5) Conclusion
What is Microsoft Excel?
Microsoft Excel, developed by Microsoft, is a functional spreadsheet program for Data Analysis, calculation, and visualisation. It's simple design and broad functionality make it the popular choice for professionals in various fields, including the financial sector. Excel facilitates financial modelling, budgeting, and reporting tasks by allowing users to organise, transform, and analyse information more precisely, efficiently, and effectively.
Along with balances and formulas, charts and pivot tables allow users to make in-depth calculations and portray insights well. This technology's availability and ease of use are its biggest strengths, making it an irreplaceable tool for professionals to improve their work and make better, informed decisions.
Importance of Excel for Finance
Excel finance for tasks like analysis, modelling, budgeting, and reporting. Its versatility allows finance professionals to handle complex calculations and manipulate information easily. Excel streamlines financial tasks and helps professionals produce insights quicker thanks to its user-friendly features like pivot tables and formulas. It is not only task-oriented but also gives users the opportunity to build their own financial models and reports, that affect the way decisions are made.
Master Excel with our comprehensive Microsoft Excel Course!
Key Excel Functions for Finance
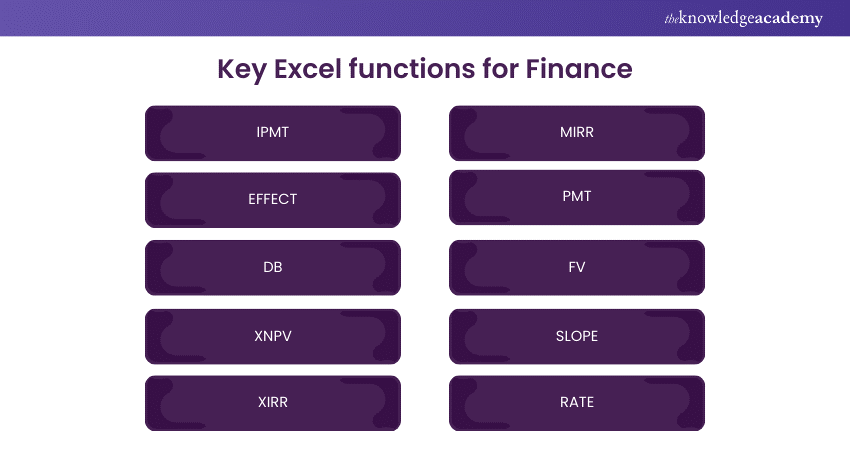
The Excel functions serve as the crucial drivers to perform financial related tasks, such as financial analysis and modeling. Here are essential Excel functions specifically selected for finance professionals, to enhance their analytical capabilities and financial computations.

1) IPMT
IPMT calculates the interest component of a loan payment for a designated period. This is one of the essential and useful functions in debt repayment analysis that provides information regarding the repayment of interest and principal over the course of time.
Syntax: IPMT(rate, per, nper, pv, [fv], [type])
2) EFFECT
EFFECT computes the effective annual interest rate, which is essential for accurately comparing different loan or investment options. It takes into account the compounding frequency, providing a standardised measure to reflect the true cost of return over a year and facilitating informed financial decisions.
Syntax: EFFECT(nominal_rate, npery)
3) DB
The DB function in Excel is useful for calculating costs related to depreciation through various methods, such as linear or reducing balance. This allows finance professionals to manage assets and share financial statements effectively.
Syntax: DB(cost, salvage, life, period, [month])
4) XNPV
The DB function in Excel is useful for calculating costs related to depreciation through various methods, such as linear or reducing balance. This allows finance professionals to manage assets and share financial statements effectively.
Syntax: XNPV(rate, values, Dates)
5) XIRR
XIRR calculates the internal rate of return for investments with varying cash flows occurring at irregular intervals. This timing and size of cash flows can help understand project or investment performance and profitability.
Syntax: XIRR(values, dates, [guess])
6) MIRR
The Modified Internal Rate of Return (MIRR) adjusts for reinvestment rates and financing costs. Additionally, the function enables overcoming traditional IRR's limitations by assuming the project reinvests at its cost of capital and finances at the firm's borrowing rate.
Syntax: MIRR(values, finance_rate, reinvest_rate)
7) PMT
PMT computes the fixed periodic payment required to repay a loan or investment, taking into account the constant payment amount and a fixed interest rate. This calculation helps seamless financial planning and budgeting for loan repayments or investment contributions.
Syntax: PMT(ratechar, nper, pv, [fv], [type])
8) FV
Future Value (FV) calculates the projected investment value or loan over time, considering factors like interest rates and compounding. This helps individuals and businesses plan for future financial goals and make informed investment decisions.
Syntax: FV(rate, nper, pmt, [pv], [type])
9) SLOPE
SLOPE calculates the slope of a linear regression line, which helps analyse relationships between variables in financial data. It quantifies the rate of change between two sets of data points, providing insights into the strength and direction of the relationship.
Syntax: SLOPE(known_ys, knoen_xs)
10) RATE
The RATE function in Excel calculates the interest rate per period for an annuity or loan. This simplifies financial analysis by allowing users to assess borrowing costs or potential investment returns, thereby aiding decision-making.
Syntax: RATE(nper, pmt, pv, [fv], [type], [guess])
Unlock the power of Excel VBA and Macros now with our Microsoft Excel VBA And Macro Training!
The Appeal of Excel for Finance Teams
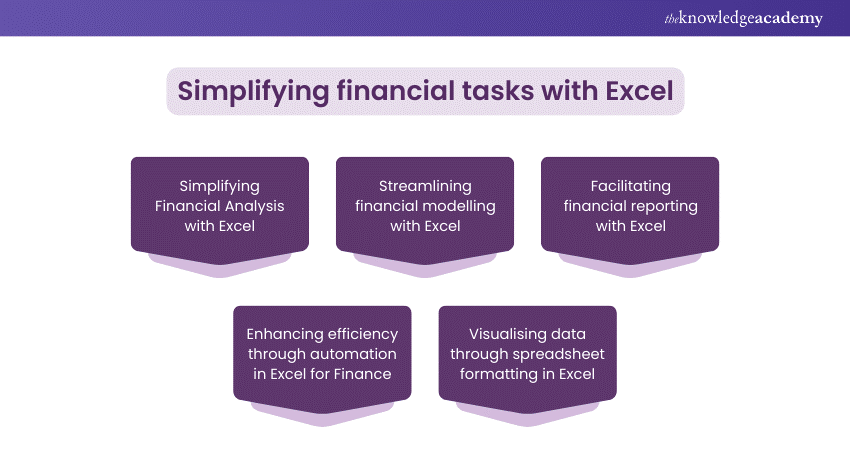
MS Excel offers a diverse array of benefits for the finance team in facilitating accurate and precise economic decision-making. Below listed are the ways Excel simplifies financial tasks:

1) Simplifying Financial Analysis With Excel
Excel's advanced calculation features and adjustable formulae make financial analysis easier. They allow users to perform complex calculations quickly, enabling them to quickly create insightful reports, whether to study trends, evaluate investment opportunities, or monitor financial performance.
This rapid analysis process allows finance professionals to confidently make data-driven choices. Additionally, Users can gain useful insights into their financial data by taking advantage of Excel's ability for improved organisational decision-making and strategic planning.
2) Streamlining Financial Modelling With Excel
Excel's flexible modeling tools allow finance teams to create complex financial models for forecasting and performance review. It further improves the modelling process by combining variables and assumptions to create reliable projections precisely.
This allows teams to make strategised and informed business decisions, predict possible outcomes, and adjust their financial strategy based on the present circumstances.
3) Facilitating Financial Reporting With Excel
Excel's formatting and graphical options make it easier to create accurate financial reports. Users can present data in attractive presentations using adjustable elements, boosting stakeholder engagement.
Excel clearly represents financial data in income statements, balance sheets, or financial reports. This not only increases comprehension but also facilitates the effective transfer of essential financial information so that stakeholders can make informed decisions.
4) Enhancing Efficiency Through Automation in Excel for Finance
Excel's automation features, like macros and advanced functions, optimise repetitive tasks and data processing in finance. By automating routine processes, teams can focus on strategic initiatives to enhance efficiency and minimise errors.Additionally, Macros allow for the recording and playback of repetitive actions, while advanced functions enable complex calculations to be executed automatically. Automation accelerates workflow and ensures accuracy and consistency, freeing resources for higher-value activities essential for organisational growth.
5) Visualising Data Through Spreadsheet Formatting in Excel
Excel's spreadsheet formatting function allows finance teams to represent their data in the form of customised charts, graphs, and pivot tables. This feature allows users to show complex financial information in an accessible and straightforward manner, enabling communication and understanding among stakeholders.
Furthermore, finance professionals can use Excel's visualisation tools to interpret data and identify key trends in a better way to empower business success.
Enhance your skills with Excel Training with Gantt Charts now!
Conclusion
Microsoft Excel is a vital tool for finance professionals, offering seamless data processing, modelling, and reporting abilities. Therefore, its importance in finance cannot be neglected. The spreadsheet tool is instrumental in performing advanced calculations, effective data visualisation, and efficient operations. Furthermore, it facilitates higher productivity, decision-making, and overall organisational success!
Elevate your accounting skills with our Excel for Accounting Course!
Frequently Asked Questions
What Excel Skills Does a Financial Analyst Need?

A financial analyst needs Excel skills such as advanced formulas (VLOOKUP, INDEX/MATCH), pivot tables, data visualisation, financial modelling, and scenario analysis. Proficiency in these areas seamlessly helps them analyse data, forecast, and effectively present insights.
How to Do Financial Accounting in Excel?

To perform financial accounting in Excel, create a structured spreadsheet that includes distinct sheets for financial statements, expenses, and income. Then, utilise pivot tables for data summaries, charts for visual insights, and formulas for computations.
What are the Other Resources and Offers Provided by The Knowledge Academy?

The Knowledge Academy takes global learning to new heights, offering over 3,000 online courses across 490+ locations in 190+ countries. This expansive reach ensures accessibility and convenience for learners worldwide.
Alongside our diverse Online Course Catalogue, encompassing 19 major categories, we go the extra mile by providing a plethora of free educational Online Resources like News updates, Blogs, videos, webinars, and interview questions. Tailoring learning experiences further, professionals can maximise value with customisable Course Bundles of TKA.
What is The Knowledge Pass, and How Does it Work?

The Knowledge Academy’s Knowledge Pass, a prepaid voucher, adds another layer of flexibility, allowing course bookings over a 12-month period. Join us on a journey where education knows no bounds.
What are the Related Courses and Blogs Provided by The Knowledge Academy?

The Knowledge Academy offers various Microsoft Excel Courses, including the Microsoft Excel VBA and Macro Training, Excel for Accounting Course, and Business Analytics with Excel Course. These courses cater to different skill levels, providing comprehensive insights into Tableau vs Excel Differences.
Our Office Applications Blogs cover a range of topics related to the Microsoft Excel, offering valuable resources, best practices, and industry insights. Whether you are a beginner or looking to advance your Microsoft Excel skills, The Knowledge Academy's diverse courses and informative blogs have you covered.
Upcoming Office Applications Resources Batches & Dates
Date
 Microsoft Excel Course
Fri 11th Apr 2025
Fri 13th Jun 2025
Fri 8th Aug 2025
Fri 26th Sep 2025
Fri 21st Nov 2025


 Top Rated Course


 If you wish to make any changes to your course, please


