


 Top Rated Course


We may not have the course you’re looking for. If you enquire or give us a call on +44 1344 203 999 and speak to our training experts, we may still be able to help with your training requirements.
How to Plot a Histogram in MATLAB Complete Guide
Eliza Taylor 07 December 2024Discover the power of Histogram in MATLAB for visualising data distributions. MATLAB Histograms are graphical representations that show the frequency of data points in different ranges. Learn how to create and customise Histograms in MATLAB to gain insights from your data. They are useful for grasping data patterns and identifying outliers.

Training Outcomes Within Your Budget!
We ensure quality, budget-alignment, and timely delivery by our expert instructors.
Table of Contents
Histogram in Matlab is a fundamental Data Visualisation tool widely used across various fields. Imagine you have a jar filled with different coloured marbles. A MATLAB Histogram would be like sorting those marbles into distinct piles based on their colour. Then, showing you how many marbles are in each pile.
This visual representation of the data distribution provides valuable insights that can inform your analysis. Additionally, you can achieve decision-making benefits from these representations. Dive deeper to learn more about MATLAB Histograms.
Table of Contents
1) What is Histogram in MATLAB?
2) Components of a Histogram in MATLAB
3) Types of Histogram Distribution in MATLAB
4) How to Plot a Histogram in MATLAB
5) Conclusion
What is Histogram in MATLAB?
Histograms are a form of a bar plot specifically for numerical data. The properties of a Histogram can be modified by adjusting the values of its properties. Changing the values is useful for quickly modifying the bin properties or displaying changes. For a more in-depth exploration of Histogram-related operations, including techniques like Matlab Convolation for advanced data analysis, MATLAB provides a versatile platform to adapt and customise these visualisations according to your specific needs.
Histograms are of various shapes:
1) Bell-shaped
2) Skewed right
3) Skewed left
4) Bimodal
5) Random
Discrete or continuous forms of data can be summarised using Histograms. Although quite like a vertical bar graph, a Histogram has no gaps between the bars.

Components of a Histogram in MATLAB
Here are the components of MATLAB Histogram:
1) Title: The title is a short description of the Histogram's information.
2) X-axis: The X-axis displays the intervals which show the value scales under which the measurements fall.
3) Y-axis: The Y-axis displays the number of times the values have occurred inside the interval bins set by the X-axis.
4) Bars: The height of each bar shows the number of times the values have occurred inside the intervals. The width of each bar shows the interval which is covered. In the case of a Histogram with equal-sized bins, the width will be consistent across all the bars.
Types of Histogram distributions in MATLAB
When a user creates a Histogram, a visual representation of the data distribution is generated. Histograms can display large volumes of data and the frequencies of the data values. A Histogram can help a user determine the median and distribution of data and display any outliers in the data. Here are descriptions of key distribution types:

1) Normal Distribution: A Normal Distribution illustrates how the points on one side of the average value are also likely to occur on the other side of the average.
2) Bimodal Distribution: This type of distribution has two peaks, where the data is separated and then analysed as two separate normal distributions.
3) Right-skewed Distribution: A Right-skewed Distribution is also referred to as a positively skewed distribution. In this distribution, there are many data values on the left side compared to fewer data values on the right side. This type of distribution typically occurs when the data has a range threshold on the Histogram’s left side.
4) Left-skewed Distribution: This distribution type is also called a negatively skewed distribution. Left-skewed distributions display many data values on the right side compared to the number of values on the left side. This distribution typically occurs when the data has a threshold range on the Histogram's right side.
5) Random Distribution: Random Distributions generally lack apparent patterns and contain many data peaks. In this distribution type, various data properties can be combined. Hence, it is recommended to separate the data and then analyse it.
6) Comb Distribution: Comb Distributions comprise bars shown alternatively by tall and short heights. These bars result from data that is rounded off or an incorrect Histogram. For example, if a temperature value is rounded off to the nearest 0.2 degrees, the bar shape would be displayed as a comb if the bar’s width is 0.1 degrees.
7) Edge Peak Distribution: This distribution is similar to the normal distribution, except it has a higher peak at one of the tails. This occurs because of an incorrect construction of the Histogram.
How to Plot a Histogram in MATLAB?
The MATLAB software uses the built-in function ‘hist()’, which allows users to plot a bar graph. The basic syntax of the function to plot a Histogram is Histogram(X). The variable ‘X’ represents the data and is a vector form.
The Histogram(X) function utilises an automatic binning algorithm which returns multiple bins of equal width. Additionally, these bins are also spread out according to the data stored in the vector ‘X’. The function also reveals the underlying distribution shape to the user. The bins are displayed in MATLAB as rectangles whose height indicates the number of elements inside the bin.
One use of the Histogram function is: Histogram(X, nbins)
This variation uses the exact number of bins specified by the variable ‘nbins’. ‘Nbins’ is a positive integer value. If this value is not specified, the Histogram automatically calculates the number of bins to display depending on the values in the vector ‘X’.
A MATLAB Histogram can also be saved with the ‘savefig()’ function. It can be loaded into the workspace again with the ‘openfig()’ function.
Example of a Histogram Plot in Matlab
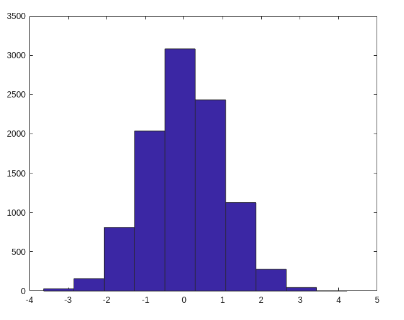
Here is a code to plot a simple Histogram in MATLAB:
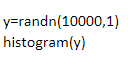
The above code will generate 10000 random numbers with the function histogram(). According to the binning algorithm, this code will automatically generate the appropriate number of bins.
Use Cases of Histogram in MATLAB
Histograms in MATLAB are a versatile tool for data analysis and visualisation, offering valuable insights into data distribution. Here are some key applications:
a) Data Distribution Analysis: Histograms are used to visualise the distribution of data points across various ranges. By plotting the frequency of data within specific intervals, you can easily identify patterns such as skewness, bimodal distribution, or uniformity. MATLAB’s histogram function is commonly used for this purpose.
b) Image Processing: In image processing, histograms help analyse the pixel intensity distribution of images. MATLAB’s imhist function displays histograms of image pixels, aiding in tasks like image enhancement, thresholding, and contrast adjustment.
c) Comparing Multiple Datasets: MATLAB allows you to overlay multiple histograms on the same graph, which is useful for comparing different datasets. This is particularly valuable when comparing test results or analysing the effect of changes in a variable over time.
d) Statistical Modeling: Histograms are helpful when fitting statistical distributions to data. By comparing the histogram of your data to a known distribution, you can visually assess the goodness of fit and decide on the appropriate statistical model to use.
e) Outlier Detection: Histograms help identify outliers by highlighting data points that fall outside the main concentration of values. This is especially useful in quality control, anomaly detection, and data cleaning processes.
f) Feature Engineering in Machine Learning: In machine learning, histograms can be used for feature extraction. Understanding the distribution of input data is crucial in preprocessing steps, particularly in normalisation, transformation, or binning of continuous variables.
These applications demonstrate the versatility and importance of histograms in various fields of data analysis and processing.
Best Practices for Using Histogram in MATLAB
Using histograms effectively in MATLAB can significantly enhance your data analysis and visualisation. Here are some best practices to maximise their utility:
a) Choose Appropriate Bin Size: Selecting the right bin size is crucial. Too few bins may oversimplify the data, while too many can lead to overfitting or misleading results. In MATLAB, you can specify bin edges manually or let MATLAB choose the optimal bin size using the auto option.
b) Label Axes and Title: Always label the x-axis and y-axis and provide a descriptive title for the histogram. This makes your visualisation easier to understand, especially when presenting results. Use xlabel, ylabel, and title functions in MATLAB to add appropriate labels and titles.
c) Use Clear Colors: Ensure that the colors used in the histogram are clear and distinct, especially when comparing multiple datasets. MATLAB allows customisation of colors through the FaceColor property. Avoid overly bright or distracting colours and opt for a color scheme that maintains readability.
d) Overlay Multiple Histograms for Comparison: When comparing datasets, overlay multiple histograms in the same plot. In MATLAB, you can do this by calling the histogram function multiple times and adjusting the transparency (using the FaceAlpha property) so that each dataset is clearly distinguishable.
e) Use Normalisation for Proportions: When comparing datasets with different sample sizes, normalising the histogram is helpful. MATLAB provides the Normalisation option, allowing you to display histograms in terms of probability density, count, or cumulative distribution.
f) Visualise Cumulative Distributions: Cumulative histograms are great for visualising the accumulation of data values over ranges. In MATLAB, use the Normalisation, cdf option to plot a cumulative distribution function (CDF). This can help identify thresholds, percentiles, or cumulative probabilities in your data.
g) Apply Logarithmic Scales: For data with large disparities between values, use a logarithmic scale on the x-axis or y-axis. This is especially useful for data that spans several orders of magnitude. In MATLAB, you can apply logarithmic scaling with the set (gca, 'YScale', 'log') or set (gca, 'XScale', 'log') commands.
By following these best practices, you can create more informative and effective histograms in MATLAB, enhancing your data analysis and visualisation efforts.
Conclusion
A Histogram in MATLAB is typically a graphical representation of data. It is plotted using MATLAB's Histogram() function and allows users to create bar graphs for any vector or matrix. Histograms utilise the automatic binning algorithm for grouping the data into bins. More importantly, they are most beneficial for analysing large datasets, patterns and outlier identification.
Learn to write code in C to create applications in MATLAB. Sign up for the C Programming Training now!
Frequently Asked Questions
Can I Integrate Other Windows Applications with MATLAB on Windows?

Certainly! You can integrate other Windows applications with MATLAB using several methods. The ActiveX/COM interface facilitates communication with applications like Microsoft Excel. Additionally, the MATLAB Engine API allows external applications to interact with MATLAB, enabling data exchange and automation.
What are the Common Shortcuts for MATLAB on Windows?
Common MATLAB shortcuts on Windows include:
a) Ctrl + N: New script
b) Ctrl + O: Open file
c) Ctrl + S: Save
d) Ctrl + Enter: Run script
e) F5: Run selected section
f) Ctrl + D: Comment/uncomment selection
g) Ctrl + Z: Undo changes
h) Ctrl + C: Stop execution
What are the Other Resources and Offers provided by The Knowledge Academy?
The Knowledge Academy takes global learning to new heights, offering over 30,000 online courses across 490+ locations in 220 countries. This expansive reach ensures accessibility and convenience for learners worldwide.
Alongside our diverse Online Course Catalogue, encompassing 17 major categories, we go the extra mile by providing a plethora of free educational Online Resources like News updates, Blogs, videos, webinars, and interview questions. Tailoring learning experiences further, professionals can maximise value with customisable Course Bundles of TKA.
What is The Knowledge Pass, and How Does it Work?
The Knowledge Academy’s Knowledge Pass, a prepaid voucher, adds another layer of flexibility, allowing course bookings over a 12-month period. Join us on a journey where education knows no bounds.
What are the Related Courses and Blogs Provided by The Knowledge Academy?
The Knowledge Academy offers various MATLAB & SPSS Trainings, including the MATLAB Course, SPSS Course, and more. These courses cater to different skill levels, providing comprehensive insights into MATLAB Operator Types.
Our Office Application Blogs cover a range of topics related to MATLAB offering valuable resources, best practices, and industry insights. Whether you are a beginner or looking to advance your MATLAB skills, The Knowledge Academy's diverse courses and informative blogs have got you covered.
 If you wish to make any changes to your course, please


