We may not have the course you’re looking for. If you enquire or give us a call on +44 1344 203 999 and speak to our training experts, we may still be able to help with your training requirements.
Training Outcomes Within Your Budget!
We ensure quality, budget-alignment, and timely delivery by our expert instructors.

When it comes to making sense of complex data in today's data-driven world, many individuals and organisations face significant challenges. From predicting future trends to making informed decisions, there are many challenges involved. This is where Regression Analysis comes in. But do you know What is Regression Analysis?
If you are curious to learn more, then this blog is for you. This blog explores Regression Analysis meaning and how it works, along with some interesting concepts. Let's dive in to learn more!
Table of Contents
1) What is Regression Analysis?
2) Types of Regression Analysis
3) Regression Analysis in Finance
4) How do Businesses Use Regression? A Real-life Example
5) Conclusion
What is Regression Analysis?
Regression Analysis is a statistical technique used to examine the relationship between a dependent variable and one or more independent variables. It helps to understand how changes in the independent variables affect the dependent variable, making it a powerful tool for prediction and decision-making.
For example:
Imagine you are a business owner who wants to understand how advertising expenditure affects sales and revenue. You collect data on your monthly advertising spend and corresponding sales revenue over the past year. Here’s how you can use Regression Analysis:
1) Data Collection: Gather data on your advertising spend (independent variable) and sales revenue (dependent variable) for each month.
2) Plotting the Data: Create a scatter plot with advertising spend on the x-axis and sales revenue on the y-axis.
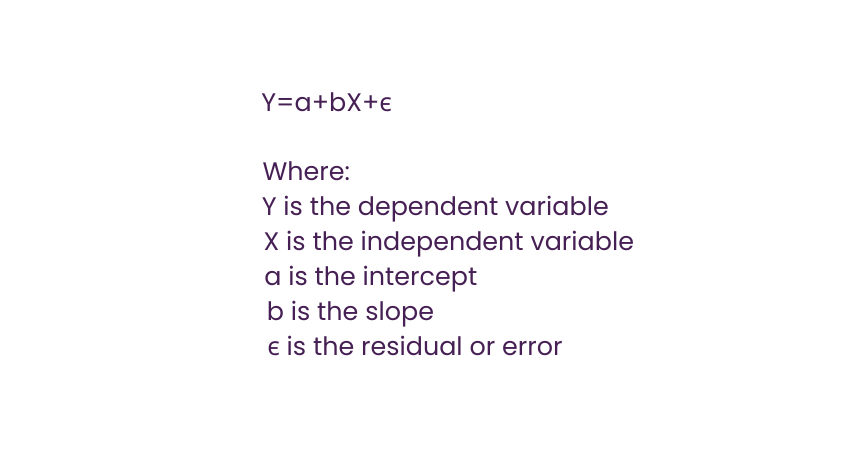
3) Fitting a Regression Line: Use statistical software to fit a regression line through the data points. The equation of the line might look something like this:

Here, (a) is the intercept, and (b) is the slope of the line.
4) Interpreting the Results: The slope ((b)) indicates how much sales revenue changes for each unit increase in advertising spend. For example, if (b = 2), it means that for every additional dollar spent on advertising, sales revenue increases by $2.
5) Making Predictions: You can use the regression equation to predict future sales revenue based on different levels of advertising spend.
How Does Regression Analysis Work?
Regression Analysis works by finding the mathematical function that best fits the data according to a specific criterion. The most common form of Regression Analysis is Linear Regression, in which the function is a straight line or a more complex linear combination of the independent variables. The Linear Regression function is expressed using the following equation:

The Linear Regression function can be estimated using various methods, such as the method of ordinary least squares, which minimises the sum of squared residuals, or the method of maximum likelihood, which maximises the probability of observing the data given the function.
Concepts of Variables
Variables are the basic units of data that are used in Regression Analysis. Variables can be classified into different types depending on their characteristics and roles in the analysis. The main types of variables are:
1) Dependent Variable
The dependent variable is the primary focus of analysis and prediction. Examples include operational data like quarterly or annual sales or experience data such as net promoter score (NPS) or customer satisfaction score (CSAT).
These variables, also known as response variables, outcome variables, or left-hand-side variables (as they appear on the left side of a regression equation), are characterised by the following:
a) Measured as the outcome of a study.
b) Depends on other variables in the study.
c) Observed only after altering other variables.
2) Independent Variable
Independent variables are the factors that influence or impact the dependent variables. For example, a price increase in Q2 could affect sales performance. To identify independent variables, consider these questions:
a) Is the variable manipulated, controlled, or used for grouping by the researcher?
b) Does this variable precede others in the timeline?
c) Are you exploring whether or how this variable impacts another?
Depending on the purpose of the analysis, independent variables might also be referred to by other terms, highlighting their role in the study.
Types of Regression Analysis
There are many types of Regression Analysis. Some of them include:
Simple Linear Regression in Regression Analysis
Simple linear regression is one of the Types of Regression Analysis that assesses the relationship between a dependent variable and a single independent variable. The simple linear regression function is expressed using the following equation:

Simple Linear Regression can be used to test whether there is a significant linear relationship between the dependent and independent variables, to measure the strength and direction of the relationship, to estimate the value of the dependent variable for a given value of the independent variable, and to assess the accuracy and reliability of the estimates. However, Simple Linear Regression has some assumptions that need to be satisfied for the results to be valid and meaningful. The main assumptions are as follows:
1) The dependent and independent variables show a linear relationship between the slope and the intercept.
2) The independent variable is not random.
3) The value of the residual is zero on average.
4) The value of the residual is constant across all observations.
5) The value of the residual is not correlated across all observations.
6) The residual values follow the normal distribution.
Shape the future of Finance with our Financial Modelling and Forecasting Training – sign up today!
Multiple Linear Regression in Regression Analysis
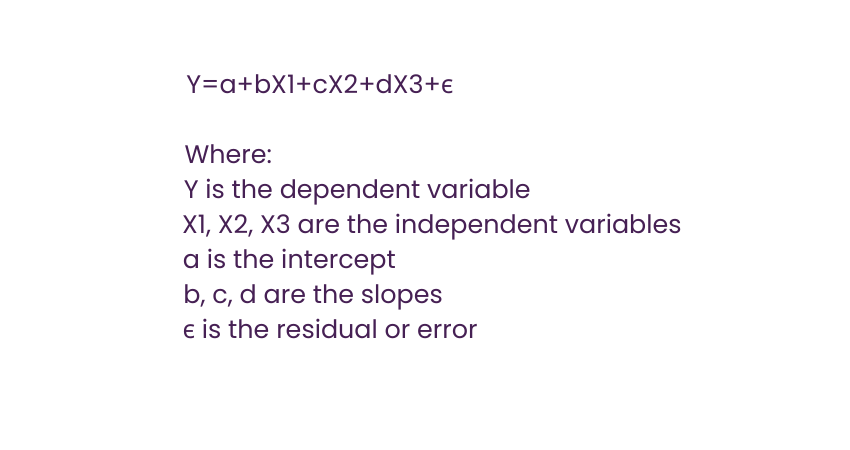
Now that you know What is Regression Analysis and Simple Linear Regression, it’s time to learn about Multiple Regression Analysis. Multiple Linear Regression assesses the relationship between a dependent variable and two or more independent variables. The Multiple Linear Regression function is expressed using the following equation:

Multiple Linear Regression can be used for the following purposes:
a) Test whether there is a significant linear relationship between the dependent and independent variables.
b) Measure the effect of each independent variable on the dependent variable.
c) Estimate the value of the dependent variable for a given set of values of the independent variables.
d) Assess the accuracy and reliability of the estimates.
Multiple Linear Regression follows the same assumptions as the simple linear model. However, since there are several independent variables in Multiple Linear Analysis, there is another important assumption that needs to be satisfied. This assumption says that independent variables should show a minimum correlation with each other. If the independent variables are highly correlated with each other, it will be difficult to assess the true relationships between the dependent and independent variables.
Elevate your financial expertise with our Accounting & Finance Training – sign up now!
Multivariate Regression Analysis
Multivariate Linear Regression Analyses multiple dependent and independent variables simultaneously, making it more complex than linear or multiple linear regression. However, its complexity allows it to tackle real-world scenarios with greater accuracy and predictive power.
Example Application:
An organisation aiming to assess the impact of the COVID-19 pandemic on employees across various markets could use multivariate linear regression. In this case:
a) Dependent Variables: Different geographical regions.
b) Independent Variables: Factors like mental health self-rating scores, remote work proportions, lockdown durations, and employee sick days.
Advantages:
a) Holistic Analysis: Examines relationships between variables comprehensively, providing a clearer understanding of their interactions.
b) Quantifiable Insights: Measures the strength and impact of relationships between variables.
c) Scenario Testing: Enables adjustments to dependent and independent variables to assess which conditions drive specific outcomes.
Limitations:
While multivariate linear regression offers a realistic and detailed perspective, it involves advanced mathematics and typically requires specialised statistical software for data analysis. Despite its complexity, it remains an invaluable tool for understanding intricate relationships in complex datasets.
Regression Analysis in Finance
Regression Analysis has many applications in Finance, as it can help analyse and model various financial phenomena, such as risk, return, valuation, and performance. Some examples of Multiple Regression Analysis in finance are as follows:
1) Beta and Capital Asset Pricing Model (CAPM)
Beta is a measure of the systematic risk of a security or a portfolio, which is the risk that cannot be eliminated by diversification. Beta reflects the sensitivity of the security or portfolio to the movements of the market.
Beta can be estimated using Regression Analysis by regressing the returns of the security or portfolio based on the returns of the market. The slope of the regression line is the beta coefficient. The higher the beta, the higher the risk and the expected return of the security or portfolio.
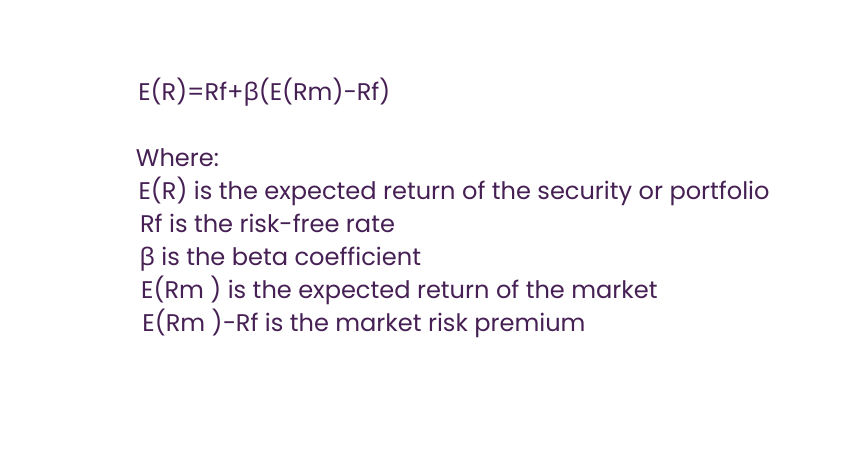
The Capital Asset Pricing Model (CAPM) describes the relationship between the risk and the expected return of a security or a portfolio. The CAPM states that the expected return of a security or a portfolio is equal to the risk-free rate plus a risk premium that depends on the beta and the market risk premium. The CAPM can be expressed using the following equation:

The CAPM can be used to estimate the required rate of return of a security or a portfolio, to evaluate the performance of a security or a portfolio. It can also be used to calculate the cost of equity of a company.
2) Predicting revenues and expenses
Regression Analysis can also be used to forecast the revenue and expenses of a company based on historical data and the relevant factors that affect them. For example, if you want to forecast the sales of a product, you can use Regression Analysis to identify the independent variables that influence the sales, such as price, advertising, quality, seasonality, and competition.
Then, you can estimate the regression function that best fits the data and use it to predict the sales for future periods, given the values of the independent variables. Similarly, if you want to forecast the costs of a project, you can use Regression Analysis to identify the independent variables that affect the costs, such as labour, materials, equipment, and duration.
How do Businesses Use Regression? A Real-life Example
Regression Analysis is often considered the "go-to method in analytics," according to Redman. Smart companies use it to make informed decisions on various business issues. As managers, it helps us understand how to influence sales, retain employees, or recruit the best talent.
1) Uses of Regression Analysis
Most companies use Regression Analysis to:
a) Explain Phenomena: Understand why something happened, such as a drop in customer service calls last month.
b) Predict Future Trends: Forecast future outcomes, like sales projections for the next six months.
c) Make Decisions: Decide on actions, such as choosing between different promotional strategies.
2) Correlation vs. Causation
It's crucial to remember that correlation does not imply causation. For example, while there might be a correlation between rain and monthly sales, it doesn't mean rain caused the sales increase. Unless you're selling umbrellas, proving a cause-and-effect relationship can be challenging.
3) Real-World Application
When you see a correlation in Regression Analysis, don't make assumptions. Instead, investigate the real-world mechanisms behind the relationship. For instance, observe consumers buying your product in the rain and talk to them to understand their motivations. The goal is to understand what's happening in the real world, not just in the data.
4) Practical Example
Redman shared his experience with weight gain and travel. He noticed that he ate more and exercised less while travelling. However, travel wasn't the direct cause of his weight gain.
He needed to understand the underlying factors, such as eating more due to nervousness in new environments. This highlights the importance of using data to guide further experiments rather than jumping to conclusions about cause and effect.
By following this approach, managers can use Regression Analysis to gain deeper insights and make more informed decisions. If you have any more questions or need further details, feel free to ask!
Regression Analysis Tools
Excel remains a widely used tool for performing basic Regression Analysis in finance. However, more advanced statistical tools are available for complex analyses.
Python and R, two powerful programming languages, have gained popularity for financial modelling, including regression. These techniques are integral to data science and machine learning, enabling models to uncover and analyse relationships within data.
Conclusion
We hope you read and understand What is Regression Analysis and how it works. This robust statistical method is essential for interpreting data and predicting outcomes. It stands as a beacon for anyone navigating the vast sea of information in various fields.
Transform your analytical skills with our Regression Analysis Training – sign up today!
Frequently Asked Questions

Correlation measures the strength and direction of a relationship between two variables, but it does not imply causation. Regression, on the other hand, not only assesses relationships but also predicts the dependent variable's value based on one or more independent variables, identifying cause-and-effect dynamics.

Regression Analysis is used to understand relationships between variables, predict future trends, and make data-driven decisions. It helps businesses optimise marketing strategies, forecast financial performance, assess product success, and determine factors influencing outcomes like sales or customer satisfaction.

The Knowledge Academy takes global learning to new heights, offering over 30,000 online courses across 490+ locations in 220 countries. This expansive reach ensures accessibility and convenience for learners worldwide.
Alongside our diverse Online Course Catalogue, encompassing 19 major categories, we go the extra mile by providing a plethora of free educational Online Resources like News updates, Blogs, videos, webinars, and interview questions. Tailoring learning experiences further, professionals can maximise value with customisable Course Bundles of TKA.

The Knowledge Academy’s Knowledge Pass, a prepaid voucher, adds another layer of flexibility, allowing course bookings over a 12-month period. Join us on a journey where education knows no bounds.

The Knowledge Academy offers various Data Science Courses, including Python Data Science Course, Advanced Data Science Certification and Pandas for Data Analysis Training. These courses cater to different skill levels, providing comprehensive insights into What is Data Processing.
Our Data, Analytics & AI Blogs cover a range of topics offering valuable resources, best practices, and industry insights. Whether you are a beginner or looking to advance your Analytics skills, The Knowledge Academy's diverse courses and informative blogs have you covered.
Upcoming Accounting and Finance Resources Batches & Dates
Date
 Regression Analysis Training
Fri 17th Jan 2025
Fri 21st Feb 2025
Fri 4th Apr 2025
Fri 6th Jun 2025
Fri 29th Aug 2025
Fri 24th Oct 2025
Fri 26th Dec 2025


 Top Rated Course


 If you wish to make any changes to your course, please


