We may not have the course you’re looking for. If you enquire or give us a call on +852 2592 5349 and speak to our training experts, we may still be able to help with your training requirements.
We ensure quality, budget-alignment, and timely delivery by our expert instructors.

Navigating the horizon of monitoring and observability tools presents a critical decision for organisations, while they figure out the Datadog vs Grafana conundrum. The distinctive features of these two platforms, shows their prominence in the domain of real-time insights and Data Analytics.
Whether you are seeking the enhanced efficiency of Datadog's integrated approach or the unmatched customisation of Grafana's open-source flexibility, understanding these solutions is highly crucial. This knowledge is important for professionals to make seamless informed decisions in IT monitoring. In this blog, you will explore the distinctions between Datadog and Grafana.
Table of Contents
1) What is Grafana?
2) What is DataDog?
3) Datadog vs Grafana comparison
4) Conclusion
What is Grafana?

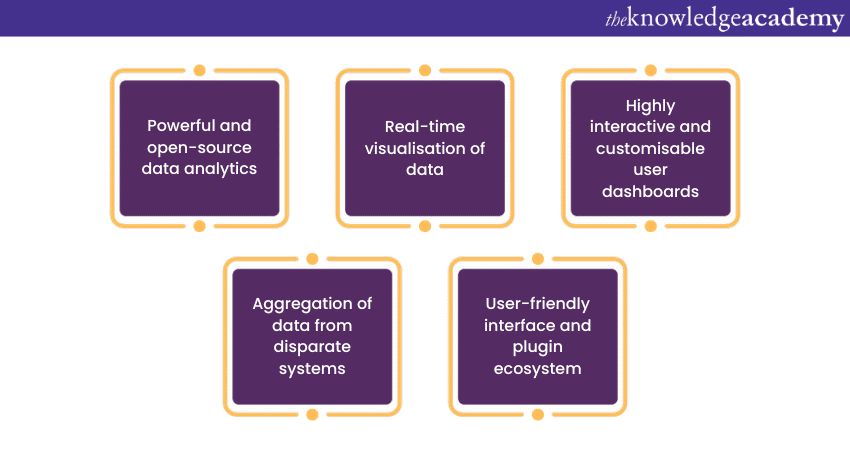
Grafana is a powerful and versatile open-source analytics and monitoring platform. It has gained widespread popularity for its ability to visualise and analyse real-time data from multiple sources.
It was originally developed in 2014 as a dashboard and data visualisation tool. However, it soon evolved into a comprehensive observability solution used by organisations across the globe.
At its core, Grafana enables users to create highly interactive and customisable dashboards. This makes it ideal for monitoring and visualising complex systems and applications. Its strength lies in its support for a wide array of data sources. These include popular databases like Graphite, Prometheus, InfluxDB, and Elasticsearch.
Advantages of Grafana
Here are the various advantages of using Grafana, have a look:
a) Open-source Flexibility: Grafana comes with an open-source platform. This enables customisation and adaptation to meet specific organisational needs, free from the limitations of proprietary software.
b) Versatile Data source Support: Grafana supports a wide array of data sources. These include popular databases like Graphite, Prometheus, InfluxDB, and Elasticsearch.
c) Intuitive Dashboard Creation: Grafana excels in offering an intuitive interface for designing visually engaging and interactive dashboards. Here, users can design Grafana dashboards seamlessly, arranging metrics, charts, and logs to fit their specific monitoring requirements. This flexibility ensures users can easily tailor their dashboards for the most relevant and insightful data that suits their needs.
d) Rich Visualisation Options: Grafana provides a wide range of visualisation options. These include traditional graphs and charts alongside more advanced options, ranging from heat maps to histograms. These diverse visualisations allow users to represent effectively and perform accurate data analysis in various formats that are suited to different monitoring needs.
e) Community-driven Ecosystem: Grafana comes with open-source features which help foster a vibrant and active community that significantly contributes to its development.
Disadvantages of Grafana
Here are the various disadvantages to using Grafana, have a look:
a) Steeper Learning Curve: Grafana comes with its extensive customisation options and feature-rich environment. These may also present a steeper learning curve for users who are new to the platform.
b) DIY Configuration Complexity: While Grafana's main benefit lies in its strength, it can also be the other way around. This is especially true for users who prefer something that is out-of-box and requires fewer customisations comparatively.
c) Enterprise Feature Costs: Although Grafana is open-source and free, some enterprise features and additional functionalities may incur associated costs.
d) Resource intensiveness: Grafana's resource requirements can be demanding, especially when dealing with large datasets or when deploying in resource-constrained environments. This can result in increased hardware costs and infrastructure complexity.
e) Limited native data storage: Grafana itself does not provide native data storage capabilities, relying on external data sources to retrieve and display information. While this approach ensures flexibility, it may pose challenges for users who prefer an all-in-one solution.
Master data-driven insights through Business Intelligence Analyst Training- Sign up today!
What is DataDog?

Datadog stands as one of the leading cloud monitoring and observability platforms that are designed to provide comprehensive insights into performance, availability, applications, and infrastructure security.
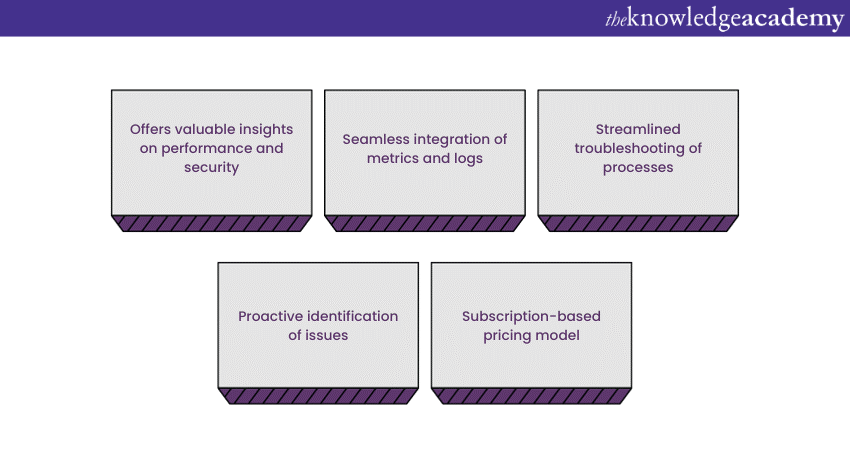
Since its inception in 2010, it has become a top-solution for organisations who are looking for unified monitoring across a diverse technology stack. At its core, DataDog offers a centralised platform that seamlessly integrates metrics, traces, and logs, providing a holistic view of an organisation's IT environment.
This unified approach streamlines troubleshooting processes and enables proactive identification of potential issues. DataDog excels in its user-friendly interface, making it usable to both technical and non-technical users, promoting collaboration across teams.
The robust features of this platform include automated anomaly detection, customisable dashboards, and powerful alerting capabilities. This covers Cloud providers, databases, containers, and more, allowing users to monitor and correlate data from various sources.
DataDog's strength also lies in its scalability, making it suitable for startups as well as large enterprises. The platform's pricing model typically revolves around a subscription-based structure, with costs based on the volume of resources being monitored.
Gain expertise in Power BI- Register for our Microsoft Power BI Course today!
Advantages of Datadog
Here are the various advantages to using Datadog, have a look:
a) Unified Monitoring Platform: Datadog is an integrated monitoring platform that provides end-to-end visibility into the performance of applications, infrastructure, and logs.
b) Ease of Use: Datadog is known for its user-friendly interface for ensuring a smooth onboarding experience.
c) Extensive Integrations: Datadog offers a vast ecosystem of out-of-the-box integrations. These cover Cloud providers, databases, containers, etc.
d) Real-time Visibility: Datadog provides visibility into real-time metrics, traces, and logs. This ability of the platform helps to correlate data from different sources. This enables users to gain timely insights, making identifying issues easier and optimising performance.
e) Pre-built Dashboards: Datadog offers pre-built dashboards that cater to everyday monitoring needs. These ready-to-use dashboards provide users with a quick and convenient way to visualise key metrics. They also facilitate rapid decision-making.
Grafana vs Kibana: Which Tool Fits Your Data Visualisation Needs?
Disadvantages of Datadog
Here are the various disadvantages to using Datadog, have a look:
a) Cost Structure: Datadog's pricing model, based on the volume of monitored resources, can lead to higher costs as organisations scale.
b) Complexity for Small Environments: While Datadog is highly scalable, its extensive feature set and pricing structure may be more complex than necessary for smaller environments.
c) Learning Curve: The robustness of Datadog's features comes with a learning curve. New users, especially those unfamiliar with sophisticated monitoring tools, may find it challenging to navigate the platform and harness its full potential.
d) Dependency on External Systems: Datadog relies heavily on integrations with external systems for various functionalities, such as log management and specific data sources.
e) Resource Usage: Datadog's resource usage, particularly in terms of memory and CPU, can be significant, especially in larger environments.
Explore the Best Grafana Alternatives for Your Monitoring Needs!
Datadog vs Grafana comparison
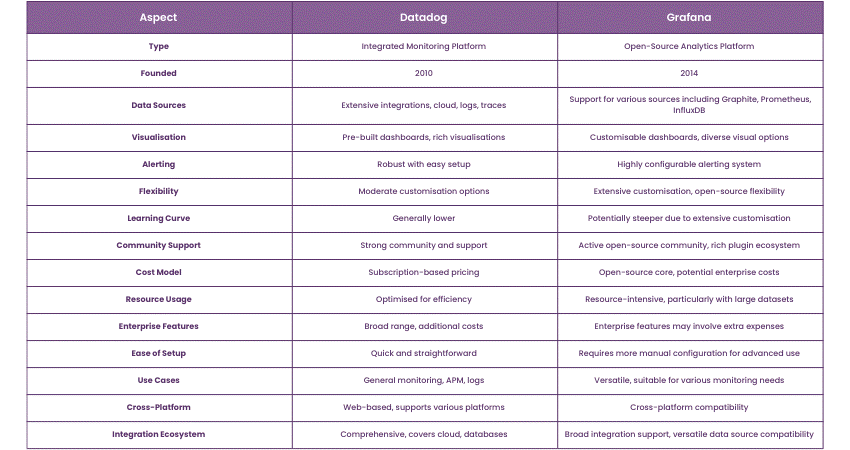
Below are the various aspects that distinguish Datadog vs Grafana, have a look:

1) Platform and Ease of Use
Datadog is an integrated monitoring platform that offers seamless metrics, traces, and logs with pre-built dashboards for quick setup. This is ideal for users seeking an all-in-one solution with minimal configuration.
In contrast, Grafana is an open-source analytics platform known for its customisation flexibility, allowing users to create tailored dashboards but requiring more setup time.
2) Data Sources and Visualisation
Datadog excels in integrating cloud services, logs, and traces with its built-in visualisation tools.
Grafana, on the other hand, assists a broader range of data sources. These include Graphite, Prometheus, and InfluxDB, which offer highly customisable and diverse visualisation options that are suited to specific needs.
3) Alerting and Flexibility
Datadog provides a robust, easy-to-configure alerting system that is perfect for users who prefer out-of-the-box solutions.
In contrast, Grafana’s alerting system is more configurable, catering to advanced users who need in-depth control and customisation for complex monitoring scenarios.
4) Cost and Resource Usage
Datadog’s subscription-based pricing can become expensive as usage grows, though it is optimised for efficiency.
While Grafana, being open-source, has a lower initial cost but may incur additional expenses for enterprise features and can be resource-intensive in large-scale deployments.
5) Community Support and Integrations
Datadog benefits from strong customer support and an established ecosystem of integrations, making it easier for users to adopt and deploy.
Contrarily, Grafana’s active open-source community drives its development. It offers a broad range of plugins and integrations that support various monitoring needs and customisation options.
Transform data into impactful insights with our Tableau Desktop Training - Sign up today!
Conclusion
In monitoring solutions, the choice between Datadog vs Grafana hinges on specific organisational needs. Datadog excels in simplicity, while Grafana offers customisation. Both platforms, with their unique strengths, cater to diverse monitoring requirements, ensuring a comprehensive approach to observability in modern IT environments.
Master Qlik Sense for advanced data analytics skills- Join our Qlik Sense Training today!
Frequently Asked Questions
Why is Datadog Growing So Fast?

Datadog is rapidly fast because it is a comprehensive, integrated monitoring platform that offers end-to-end visibility across applications, infrastructure, and logs. Moreover, its user-friendliness, vast integrations, and real-time insights make it a preferred choice for businesses across the world.
What is the Future of Datadog?

The future of Datadog looks promising as it continues to expand its Cloud-based monitoring solutions. In addition, with its ongoing AI innovations, Machine Learning (ML), and real-time data analytics, Datadog aims to enhance its capabilities allowing the company to offer more comprehensive observability tools for modern IT environments.
What are the Other Resources and Offers Provided by The Knowledge Academy?

The Knowledge Academy takes global learning to new heights, offering over 3,000 online courses across 490+ locations in 190+ countries. This expansive reach ensures accessibility and convenience for learners worldwide.
Alongside our diverse Online Course Catalogue, encompassing 19 major categories, we go the extra mile by providing a plethora of free educational Online Resources like News updates, Blogs, videos, webinars, and interview questions. Tailoring learning experiences further, professionals can maximise value with customisable Course Bundles of TKA.
What is The Knowledge Pass, and How Does it Work?

The Knowledge Academy’s Knowledge Pass, a prepaid voucher, adds another layer of flexibility, allowing course bookings over a 12-month period. Join us on a journey where education knows no bounds.
What are the Related Courses and Blogs Provided by The Knowledge Academy?

The Knowledge Academy offers various Business Intelligence Reporting Courses, including Grafana Training, Business Intelligence Analyst Course, and Qlik Sense Training. These courses cater to different skill levels, providing comprehensive insights into Business Intelligence Analyst Salary: A Brief Guide.
Our Office Application Blogs cover a range of topics related to Office Application Management, offering valuable resources, best practices, and industry insights. Whether you are a beginner or looking to advance your Office Productivity skills, The Knowledge Academy's diverse courses and informative blogs have got you covered.
Upcoming Office Applications Resources Batches & Dates
Date
 Grafana Training
Fri 28th Mar 2025
Fri 23rd May 2025
Fri 4th Jul 2025
Fri 24th Oct 2025
Fri 5th Dec 2025


 Top Rated Course


 If you wish to make any changes to your course, please


