


 Top Rated Course

We may not have the course you’re looking for. If you enquire or give us a call on +44 1344 203999 and speak to our training experts, we may still be able to help with your training requirements.
15 Types of Flowchart: Which One is Right for Your Needs
Eliza Taylor 27 November 2024Explore the different Types of Flowcharts, such as Decision Flowchart, Swimlane Flowchart, and EDP Flowchart, to find the best fit for your processes. In this blog, we delve into the most common flowchart types, outlining their key features, best uses, and benefits. Elevate your workflow and achieve unmatched efficiency!

Training Outcomes Within Your Budget!
We ensure quality, budget-alignment, and timely delivery by our expert instructors.
Table of Contents

Have you ever wondered how businesses streamline their operations or how Developers debug intricate code? The answer often lies in the various Types of Flowcharts they use. Flowcharts are more than just diagrams; they are powerful tools that can transform complex processes into clear, visual maps. From decision-making to data processing, flowcharts provide a universal language that simplifies and clarifies.
Let’s dive into the world of flowcharts and explore their diverse applications. By the end of this journey, you’ll not only know the various Types of Flowcharts but also how to leverage them to achieve your goals. Are you ready to discover how flowcharts can simplify your work and boost efficiency? Let’s dive in!
Table of Contents
1) What is a Flowchart?
2) The Importance of Flowcharts
3) Most Common Types of Flowcharts
a) Decision Flowchart
b) Process Flowchart
c) Swimlane Flowchart
d) EDP Flowchart
e) EPC Diagram
f) Document Flowchart
g) System Flowchart
h) Workflow Diagram
i) Product Flowchart
j) PERT Chart
4) Conclusion
What is a Flowchart?
Flowcharts are visual diagrams that represent a process, workflow, or system by using symbols, arrows, and lines to illustrate the sequence and relationships between tasks. It simplifies complex processes by breaking them down into individual steps, allowing for better understanding and analysis.
Flowcharts are widely used across industries to document procedures, plan projects, make decisions, or streamline operations. They make it easier to communicate ideas clearly and identify inefficiencies or bottlenecks. Whether in Project Management, Software Development, or business operations, flowcharts provide a clear and structured way to map out processes visually.

The Importance of Flowcharts
Flowcharts are widely used in multiple fields, from engineering to business, because they:
a) Simplify Complex Processes: By breaking down workflows into smaller, manageable steps, flowcharts enable you to visualise the whole process in a clear, structured way.
b) Enhance Communication: Flowcharts offer a universal language that simplifies Communication between departments, especially when collaborating on complex tasks.
c) Support Decision-making: They help organisations make informed decisions by mapping out various outcomes and paths.
d) Increase Efficiency: Flowcharts identify bottlenecks, inefficiencies, and unnecessary steps in processes, making it easier to streamline workflows.
Learn to create dynamic reports and dashboards with Microsoft Power BI Course for impactful business intelligence!
Most Common Types of Flowcharts
Here are the common Types of Flowcharts:
1) Decision Flowchart
Best For:
Ideal for decision-making processes with multiple outcomes, such as Project Management and problem-solving.
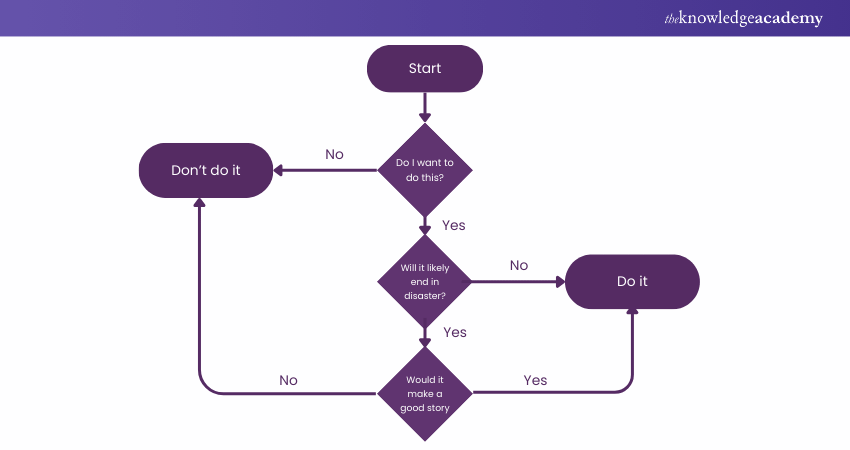
Features:
a) Maps decision points with conditional branching.
b) Visualises multiple process paths based on outcomes.
Pros:
a) Enhances clarity in decision-making.
b) Simplifies complex choices.
c) Reduces errors by structuring decisions.
Cons:
a) It can become complex with too many decision points.
b) Requires detailed planning.
2) Process Flowchart
Best For:
It is ideal for outlining sequential steps in a process and is commonly used for documenting standard operating procedures (SOPs) and workflows.
Features:
a) Displays a linear sequence of tasks or activities.
b) Represents the start, process, and end of a workflow.
Pros:
a) Provides a clear visual of each step in a process.
b) Easy to follow and implement across teams.
c) Helps identify inefficiencies.
Cons:
a) It may become too simplistic for complex workflows.
b) Limited in showing decision points or parallel tasks.
Simplify complex workflows by mastering Flowchart And Process Mapping Training to boost productivity and enhance decision-making!
3) Swimlane Flowchart
Best For:
Perfect for processes that involve multiple departments or roles, ensuring accountability and clear division of tasks.
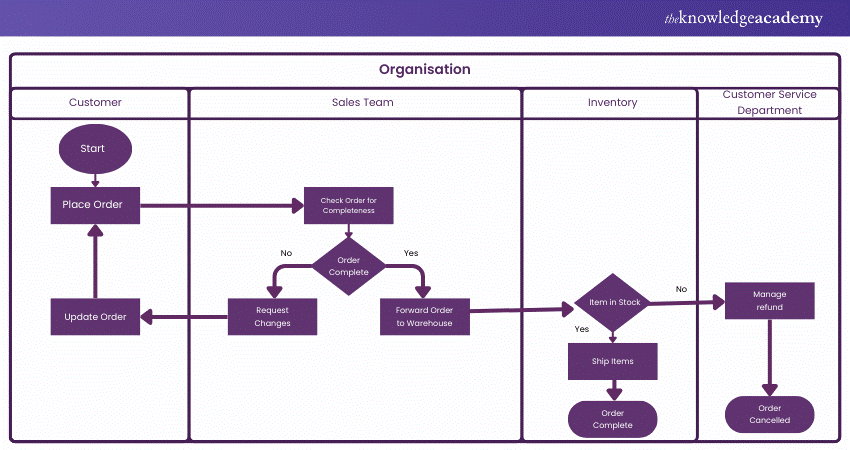
Features:
a) Divide the flowchart into “swimlanes” for different roles or departments.
b) Visualises how tasks move between different entities.
Pros:
a) Highlights cross-departmental collaboration.
b) Clarifies role-specific responsibilities.
c) Useful for identifying bottlenecks in multi-team processes.
Cons:
a) It can become cluttered with too many lanes.
b) Requires clear distinctions between roles to be effective.
4) EDP Flowchart
Best For:
Best suited for electronic data processing tasks, commonly used in IT and systems analysis.
Features:
a) Focuses on computer-based processes and data handling.
b) Maps out the flow of data in automated systems.
Pros:
a) Clarifies data processing steps.
b) Ideal for troubleshooting system issues.
c) Enhances understanding of complex data systems.
Cons:
a) It may require technical knowledge to interpret.
b) Not suitable for non-technical users.
5) EPC Diagram
Best For:
Ideal for business process modelling, especially in industries like logistics and manufacturing.
Features:
a) Represents events and processes in a business workflow.
b) Shows logical relationships between business activities.
Pros:
a) Optimises workflow efficiency.
b) Helps in identifying improvement areas.
c) Widely used in business process automation.
Cons:
a) It can be complex for simple processes.
b) Requires expertise in business modelling.
6) Document Flowchart
Best For:
Great for documenting how information or documents move through a system, especially in administrative processes.
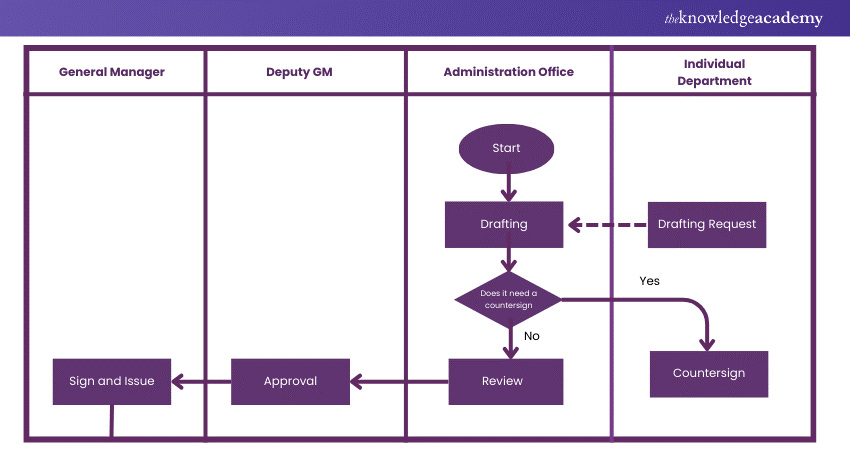
Features:
a) Shows the flow of documents within a process.
b) Maps out the document approval and handling stages.
Pros:
a) Simplifies complex document workflows.
b) Ensures consistency in document management.
c) Useful for compliance and auditing.
Cons:
a) Can be too detailed for high-level processes.
b) It may become outdated quickly if processes change frequently.
7) System Flowchart
Best For:
Designed to map out system operations and illustrate data flow between system components.
Features:
a) Shows the interaction between different hardware and software elements.
b) Visualises data processing in IT systems.
Pros:
a) Great for diagnosing system problems.
b) Helpful in system design and development.
c) Visualises the entire system in one view.
Cons:
a. Requires technical knowledge to interpret.
b. It can become complicated for large systems.
8) Workflow Diagram
Best For:
Excellent for improving efficiency in routine tasks, especially in Project Management and business operations.
Features:
a) Represents the flow of tasks or activities.
b) Focuses on optimising task transitions and timelines.
Pros:
a) Boosts task management and productivity.
b) Highlights gaps or delays in processes.
c) Easy to create and follow.
Cons:
a) Limited in representing decision points or complex branching.
b) May oversimplify workflows with too many details.
9) Product Flowchart
Best For:
Ideal for mapping out the stages of product creation and delivery, commonly used in manufacturing and logistics.
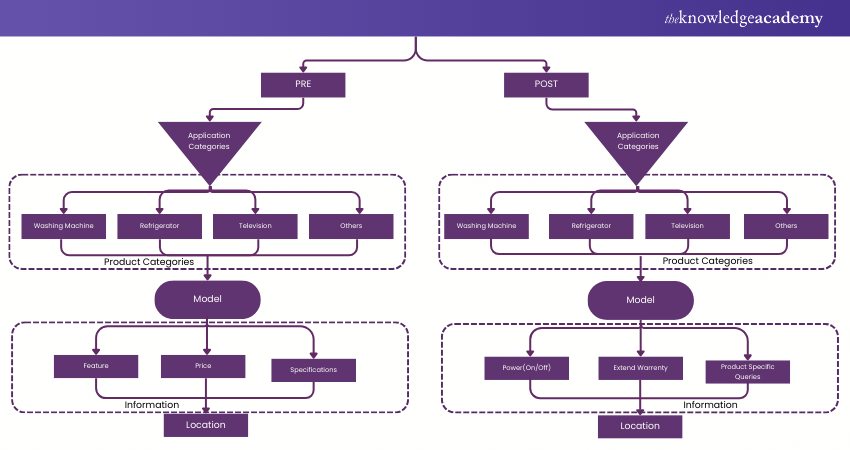
Features:
a) Illustrates the flow of materials, ingredients, or components through production stages.
b) Tracks a product’s journey from raw material to final product.
Pros:
a) Helps ensure consistency in production.
b) Identifies inefficiencies in the supply chain or production.
c) Useful for quality control.
Cons:
a) Focused solely on product flow, not suitable for non-manufacturing processes.
b) It may become complex with too many stages or inputs.
10) PERT Chart
Best For:
Perfect for Project Management, especially for tasks that need to be completed within specific timelines.
Features:
a) Represents project tasks and timelines.
b) Shows dependencies and critical paths between tasks.
Pros:
a) Helps in scheduling and time management.
b) Identifies task dependencies and bottlenecks.
c) Ensures projects stay on track.
Cons:
a) It can be complex for smaller projects.
b) Requires careful tracking and updating.
11) Code Flowchart
Best For:
Best for programmers and Developers to map out the logical flow of code or algorithms.
Features:
a) Visualises the flow of instructions in a program.
b) Shows how different parts of code interact.
Pros:
a) Makes debugging easier.
b) Clarifies complex logic for better understanding.
c) Helpful for optimising code.
Cons:
a) Requires knowledge of programming to interpret.
b) It can become too detailed for large codebases.
12) Business Process Flowchart
Best For:
Ideal for optimising business workflows and ensuring productivity across teams and operations.
Features:
a) Maps out business processes and workflows.
b) Identifies inefficiencies and bottlenecks.
Pros:
a) Improves operational efficiency.
b) Clarifies responsibilities and processes across departments.
c) Highlights areas for improvement.
Cons:
a) It can be too detailed for small processes.
b) Requires careful planning to ensure accuracy.
Unlock the power of Business Objects reporting with our comprehensive Business Objects Reporting Course today!
13) Data Flow Diagram
Best For:
Perfect for representing how data moves through a system, it is commonly used in Software Development and system design.
Features:
a) Shows how data flows between entities such as users, systems, or storage.
b) Focuses on the movement of data, not tasks.
Pros:
a) Enhances understanding of data flows in a system.
b) Great for identifying data bottlenecks or redundancies.
c) Helps in designing efficient systems.
Cons:
a) Requires technical knowledge to create and interpret.
b) Limited in representing tasks or workflows.
14) Communication Flowchart
Best For:
Ideal for visualising how communication moves within an organisation or between stakeholders.
Features:
a) Maps out the flow of communication and information sharing.
b) Shows interactions between teams or departments.
Pros:
a) Helps improve communication efficiency.
b) Identifies gaps or breakdowns in communication.
c) Useful for building communication strategies.
Cons:
a) Limited communication flow, not task flow.
b) It can become complex in large organisations.
15) Customer Journey Flowchart
Best For:
Great for businesses looking to map the customer experience, from initial contact through to post-purchase interactions.
Features:
a) Tracks customer touchpoints and interactions with a business.
b) Maps the customer’s journey through different stages.
Pros:
a) Helps improve customer experience.
b) Identifies pain points in the customer journey.
c) Guides better engagement strategies.
Cons:
a) It can be too detailed if focusing on every touchpoint.
b) Requires regular updates as customer behaviour changes.
Unlock powerful reporting techniques with our Crystal Reports Training and elevate your analytical capabilities!
Conclusion
Understanding the different Types of Flowcharts - from Decision Flowcharts to Swimlane Flowcharts - can significantly streamline your processes and improve decision-making. From decision-making to workflow management, flowcharts offer a clear path to greater efficiency and productivity. It's time to optimise and take your workflow to the next level!
Master Business Intelligence Reporting Training to transform data into actionable insights for smarter decision-making!
Frequently Asked Questions
How are Flowcharts Classified?

Flowcharts are classified based on their purpose and the type of information they represent.
Which Chart is Best for Process Flow?
The Process Flowchart is the best choice for representing sequential steps in a process. It provides a clear visual of tasks from start to finish, making it ideal for documenting standard operating procedures (SOPs) and workflow management.
What are the Other Resources and Offers Provided by The Knowledge Academy?
The Knowledge Academy takes global learning to new heights, offering over 30,000 online courses across 490+ locations in 220 countries. This expansive reach ensures accessibility and convenience for learners worldwide.
Alongside our diverse Online Course Catalogue, encompassing 19 major categories, we go the extra mile by providing a plethora of free educational Online Resources like News updates, Blogs, videos, webinars, and interview questions. Tailoring learning experiences further, professionals can maximise value with customisable Course Bundles of TKA.
What is The Knowledge Pass, and How Does it Work?
The Knowledge Academy’s Knowledge Pass, a prepaid voucher, adds another layer of flexibility, allowing course bookings over a 12-month period. Join us on a journey where education knows no bounds.
What are the Related Courses and Blogs Provided by The Knowledge Academy?
The Knowledge Academy offers various Business Intelligence Reporting, including FlowChart And Process Mapping Training, Microsoft Power BI Course and Tableau Desktop Training. These courses cater to different skill levels, providing comprehensive insights into Creating Date Hierarchy in Power BI.
Our Office Applications Blogs cover a range of topics related to Flowchart, offering valuable resources, best practices, and industry insights. Whether you are a beginner or looking to advance your Office Applications skills, The Knowledge Academy's diverse courses and informative blogs have got you covered.
Upcoming Office Applications Resources Batches & Dates
Date
 FlowChart and Process Mapping Training
FlowChart and Process Mapping Training
Fri 24th Jan 2025
FlowChart and Process Mapping Training
Fri 21st Mar 2025
FlowChart and Process Mapping Training
Fri 2nd May 2025
FlowChart and Process Mapping Training
Fri 27th Jun 2025
FlowChart and Process Mapping Training
Fri 29th Aug 2025
FlowChart and Process Mapping Training
Fri 3rd Oct 2025
FlowChart and Process Mapping Training
Fri 5th Dec 2025
 If you wish to make any changes to your course, please


