We may not have the course you’re looking for. If you enquire or give us a call on +918037244591 and speak to our training experts, we may still be able to help with your training requirements.
We ensure quality, budget-alignment, and timely delivery by our expert instructors.
- Quick Powerful Graphics with Power View, PowerPivot, Power Query, Power Map and Power BI M55164
- Microsoft Power BI for End Users 55400AC
- Retired : Designing and Implementing Enterprise-Scale Analytics Solutions Using Microsoft Azure and Microsoft Power BI DP500
- Microsoft Power BI Data Analyst PL300
- Microsoft BI Training

Is your organisation facing a tough decision on which reporting and Data Visualisation tool to choose? The debate between SSRS vs Power BI is crucial, as each offers unique ways to turn data into actionable insights.
In this blog, we will discuss the various features of SSRS vs Power BI key differences and help you understand which one to choose. Read more!
Table of Contents
1) Brief overview of SSRS and Power BI
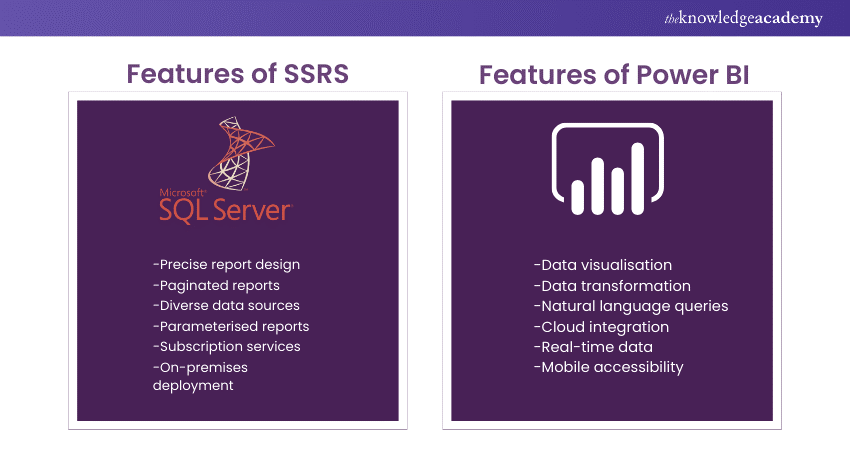
a) Features of SSRS
b) Features of Power BI
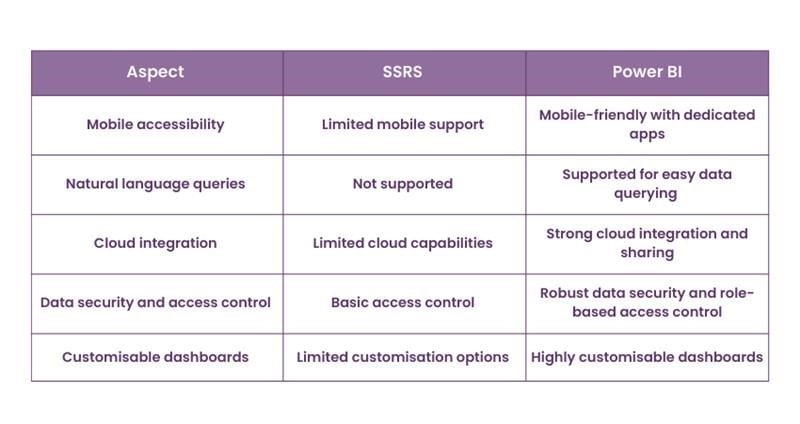
2) Key Differences between SSRS and Power BI
3) Choosing between SSRS and Power BI
4) Conclusion
Brief overview of SSRS and Power BI
Server Reporting Services (SSRS) is a reporting tool developed by Microsoft. It focuses on creating structured reports often used for financial statements and operational documents. It offers precise control over report design and supports various data sources.
Power BI, also developed by Microsoft, is a Business Intelligence tool that specialises in data visualisation and interactive reports. It excels at creating visually engaging dashboards and offers advanced data transformation and modelling capabilities. It's suitable for both technical and non-technical users.
Features of SSRS
SQL Server Reporting Services (SSRS) offers several features that make it a robust reporting tool. Discussed below are some of its features:
a) Report Design: SSRS allows you to create reports with precise control over layout and formatting, so you can make your reports look just the way you want.
b) Data Sources: It can connect to various data sources, like databases and spreadsheets, to fetch data for your reports.
c) Parameterised Reports: You can set parameters in your reports to make them interactive, allowing users to filter data as per their needs.
d) Subscription Services: SSRS enables you to schedule and automatically deliver reports to people via email or other methods. Thus, it makes sure that the right information reaches the right hands at the right time.
e) Custom Branding: You can customise the look and feel of your reports with your organisation's branding, ensuring a consistent and professional appearance.
f) Security: SSRS has robust security features, allowing you to control who can access and view specific reports, ensuring data confidentiality.
Master your data with Power BI Slicer and make smarter decisions through interactive reports.
Features of Power BI
Power BI has several key features that make it a popular choice for data visualisation:
a) Data Visualisation: Power BI offers a wide range of visualisations, like charts and graphs, to make data more understandable.
b) Data Transformation: It allows you to clean, shape, and transform your data from various sources, ensuring it's ready for analysis.
c) Natural Language Queries: You can ask questions in everyday language to get insights from your data, making it user-friendly.
d) Cloud Integration: Power BI seamlessly integrates with the cloud, allowing easy sharing and collaboration on reports and dashboards.
e) Customisable Dashboards: You can create customised dashboards with drag-and-drop simplicity, tailoring them to your organisation's needs.
f) Real-time Data: Power BI can connect to live data sources, providing up-to-the-minute information.
Supercharge your Tableau expertise with Tableau Desktop Training. Join now!
Key Differences between SSRS and Power BI
In this section we will discuss about the key differences between SSRS and Power BI.
1) Purpose and Use Cases
SSRS primarily focuses on generating paginated reports, which are structured documents that display data in a tabular format. It's well-suited for organisations that require traditional, fixed-format reports, such as financial statements, invoices, and operational information.
On the other hand, Power BI is designed for data visualisation and creating interactive, visually appealing reports and dashboards. It is ideal for organisations that need agile, self-service data analysis and those who want to empower business users to explore data and gain insights.
2) Report Design and Layout
SSRS provides extensive tools for designing reports with precise control over layout and formatting. It uses a more structured approach for report design.
Power BI has a more intuitive and user-friendly interface for creating reports, making it accessible to a broader audience. It focuses on interactive and visually appealing designs.
3) Data Sources and Integration
SSRS can connect to various data sources, including SQL Server, Oracle, and ODBC sources. It supports a wide range of data connections but may require more configuration for some data sources.
On the contrary, Power BI excels at integrating with various data sources, including cloud-based sources like Asure. It provides advanced data modelling and transformation capabilities, making it more versatile in handling different types of data.
4) Deployment Options
SSRS is typically deployed on-premises, giving organisations full control over their reporting environment. This is important for security and compliance but may require more infrastructure management.
On the other hand, Power BI offers both on-premises and cloud-based deployment options. The cloud-based service is more scalable and allows for easier sharing and collaboration with users both inside and outside the organisation
5) Licensing and Cost
If you have a SQL Server license, you likely have access to SSRS at no additional cost. However, there may be expenses related to server infrastructure and maintenance.
Power BI, on the other hand, offers various pricing tiers, including a free version and paid subscriptions. The cost depends on the number of features and the scale of usage required, making it more adaptable to different budgets.
6) User Skill Level
SSRS is often considered more technical and is typically used by IT professionals or report developers. It may have a steeper learning curve, especially for those who are not experienced with database and report design.
On the contrary, Power BI is designed to be user-friendly, making it accessible to business users and analysts with varying technical backgrounds. Its intuitive interface allows users to create reports and dashboards with less technological expertise.

7) Data Interaction
SSRS reports are generally static and less interactive. They are typically designed for printing or exporting to a specific format, and interaction is limited.
On the other hand, Power BI reports and dashboards are highly interactive. Users can explore data, filter information, and ask questions in plain language, making it ideal for data discovery and exploration.
8) Real-time Data
SSRS is primarily used for generating batch reports. While it can display data up to the time of the last report refresh, it is not designed for real-time data analysis.
On contrary, Power BI can connect to live data sources, providing real-time or near-real-time insights. This makes it suitable for scenarios where up-to-the-minute data is critical.
9) Scalability
SSRS is suitable for organisations that require a reliable and scalable solution but often needs more manual scaling and infrastructure management.
Power BI offers more scalable options, particularly in its cloud-based service, making it a better choice for organisations looking to expand or contract their reporting capabilities as needed.
10) Collaboration
Collaboration in SSRS is typically limited to sharing generated reports through conventional methods like email. It lacks real-time collaboration features.
On the other hand, Power BI includes collaboration features that allow multiple users to work on reports and dashboards simultaneously, making it well-suited for team collaboration.

Choosing Between SSRS and Power BI
Deciding between SSRS and Power BI depends on what your organisation needs in terms of reporting and data visualisation. In some cases, organisations even choose to use both SSRS and Power BI to combine their strengths for different reporting needs. Discussed below are two scenarios to select SSRS and Power BI.
Shape your Microsoft BI knowledge with the Microsoft Power BI Certification Training – Join today!
When to Choose SSRS?
You should choose SSRS if:
a) You need structured, paginated reports like financial statements
b) Precise control over report design is crucial
c) Your data sources are primarily relational databases
d) On-premises deployment is preferred, with full control over infrastructure
e) You have a SQL Server license and want to avoid additional licensing costs
When to Choose Power BI?
You should choose Power BI if:
a) You want interactive, visually appealing reports and dashboards
b) Accessibility to a broader audience, including non-technical users, is important
c) You require versatile data integration, including cloud-based sources
d) Scalability and real-time data analysis are critical
e) Collaboration and real-time sharing of reports are essential
f) User-friendly and intuitive report creation is a priority
Shape your Microsoft BI knowledge with our Microsoft Power BI Certification – Join today!
Conclusion
Ultimately, the choice between SSRS vs Power BI hinges on your organisation’s specific needs and priorities. In this blog, we’ve discovered that SSRS excels in generating precise, structured reports, while Power BI shines in creating visually engaging data. Now, it’s up to you to choose wisely.
Explore Business Intelligence Reporting Courses to enhance your business reporting skills. Sign up today!
Frequently Asked Questions
Is SSRS Being Replaced by Power BI?

No, SSRS (SQL Server Reporting Services) is not being replaced by Power BI. While Power BI offers modern Data Visualisation and interactive dashboards, SSRS remains relevant for paginated, highly formatted reports. Organisations often use both tools for their unique strengths in reporting and data analysis.
What is the Disadvantage of SSRS?

SSRS has limitations like a complex learning curve and less interactive, static reporting compared to modern BI tools. It lacks real-time data integration and advanced visualisations found in platforms like Power BI, making it less flexible for dynamic reporting needs.
What are the Other Resources and Offers Provided by The Knowledge Academy?

The Knowledge Academy takes global learning to new heights, offering over 3,000 online courses across 490+ locations in 190+ countries. This expansive reach ensures accessibility and convenience for learners worldwide.
Alongside our diverse Online Course Catalogue, encompassing 19 major categories, we go the extra mile by providing a plethora of free educational Online Resources like News updates, Blogs, videos, webinars, and interview questions. Tailoring learning experiences further, professionals can maximise value with customisable Course Bundles of TKA.
What is The Knowledge Pass, and How Does it Work?

The Knowledge Academy’s Knowledge Pass, a prepaid voucher, adds another layer of flexibility, allowing course bookings over a 12-month period. Join us on a journey where education knows no bounds.
What are the Related Courses and Blogs Provided by The Knowledge Academy?

The Knowledge Academy offers various Business Intelligence Reporting Courses, including Microsoft Power BI Course, Tableau Desktop Training, and DAX Training. These courses cater to different skill levels, providing comprehensive insights into Power BI Slicers.
Our Office Applications Blogs covers a range of topics related to Power BI, offering valuable resources, best practices, and industry insights. Whether you are a beginner or looking to advance your Data Visualisation Skills, The Knowledge Academy's diverse courses and informative blogs have you covered.
Upcoming Office Applications Resources Batches & Dates
Date
 Microsoft Power BI Course
Wed 9th Apr 2025
Wed 11th Jun 2025
Wed 6th Aug 2025
Wed 8th Oct 2025
Wed 3rd Dec 2025


 Top Rated Course


 If you wish to make any changes to your course, please


