We may not have the course you’re looking for. If you enquire or give us a call on + 1-866 272 8822 and speak to our training experts, we may still be able to help with your training requirements.
We ensure quality, budget-alignment, and timely delivery by our expert instructors.

Tableau vs Excel is one of the most trending debates in the Data Science community. Mostly, Excel is an established spreadsheet platform that has been around for decades. Whereas, Tableau is a relative newcomer to the domain, with many aspiring Data Scientists wondering about its benefits compared to Excel.
With a 40-year history, Microsoft's Excel holds a firm grasp over the spreadsheet software market. But Tableau has emerged as its primary competitor. This blog will tell you all you need to know about the Tableau vs Excel debate, including a detailed comparison of its features and benefits. Read to find out more!
Table of Contents
1) What is Tableau?
2) What is Excel?
3) Difference between Tableau and Excel
4) Can Tableau and Excel be used together?
5) Conclusion
What is Tableau?
Tableau is a Business Intelligence (BI) software that facilitates creating and visualising interactive and shareable dashboards within a few clicks. This Business Intelligence tool sets correlations apart using colour, size, labels, and shapes – giving one additional context as one tries to explore data right to the minute detail. In a nutshell, this BI software allows non-technical users to visualise data and work with it almost in real-time, conveniently lowering the knowledge barriers. Let's look at the benefits and limitations of Tableau to understand the differences between Tableau vs Excel.
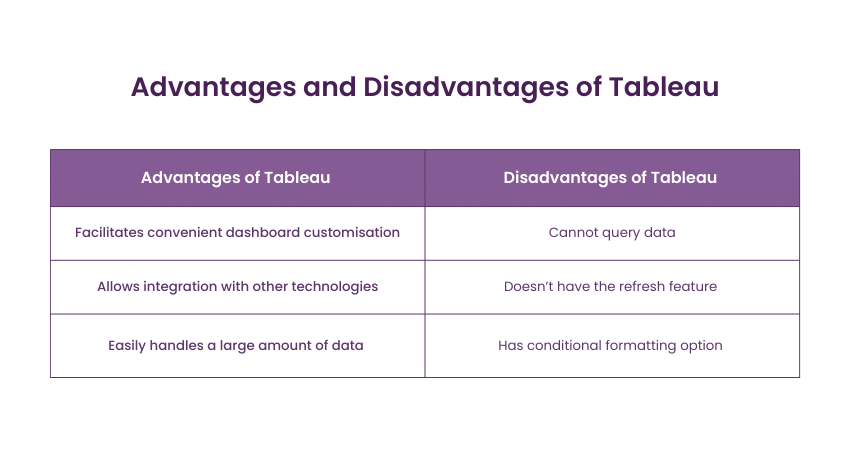
Advantages of Tableau
Tableau has several advantages that it provides to users, some of which are mentioned as follows:
a) Tableau Dashboard consists of an outstanding reporting feature that facilitates convenient dashboard customisation. This feature can only be used on a mobile phone or laptop.
b) Tableau allows integration with other technologies. Tableau users can use Python or R scripts to perform complex calculations.
c) It can easily handle a large amount of data.

Disadvantages of Tableau
While it does offer several advantages, Microsoft Excel also has several disadvantages, which are mentioned as follows:
a) While Tableau is a convenient tool for Data Visualisation, it cannot query data.
b) Tableau does not offer the feature to refresh its reports with the help of automatic scheduling.
c) The users do not appreciate the conditional formatting option and limited 16-column table displays provided by Tableau.

What is Excel?
Microsoft Excel is a spreadsheet application that performs calculations, statistical operations, data analysis, and reporting. It stores data in rows and columns. This data is usually held in boxes made by the intersection of the rows and columns, known as cells. One can add tables, charts, graphics and various visualisations to make the spreadsheet more informative and presentable as per their specific requirements. Let's look at the benefits and limitations of Excel to understand the differences between Tableau vs Excel.
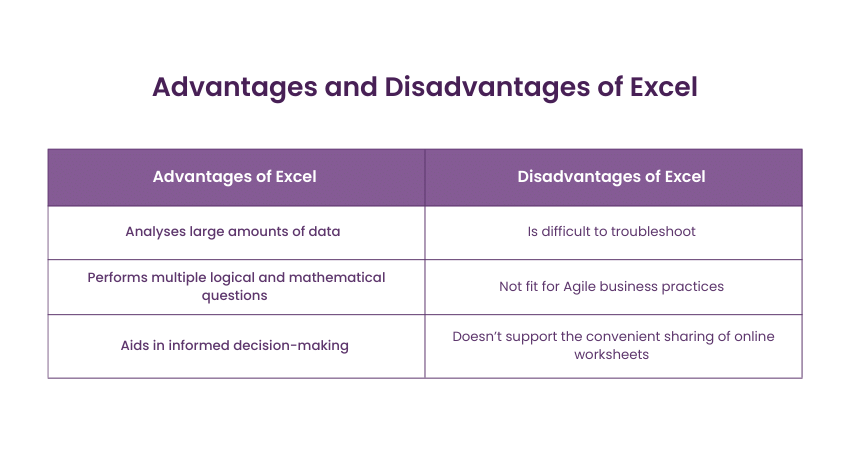
Advantages of Excel
Microsoft Excel has a few advantages that it provides to users, some of them are as follows:
a) Excel can analyse large amounts of data to identify trends and patterns that help in more informed decision-making.
b) Excel can perform a majority of mathematical and logical functions with ease.
Unlock your full potential with our Microsoft Excel Course and become a spreadsheet virtuoso today!
Disadvantages of Excel
While it does offer several advantages, Microsoft Excel also has several disadvantages, which are as follows:
a) Excel is difficult to troubleshoot, i.e., trace, analyse and correct faults or problems.
b) Excel is not considered to be fit for agile business practices.
c) Excel does not facilitate the convenient sharing of worksheets online.

Difference between Tableau and Excel
Tableau and Excel are often compared to each other. Both the data analysis tools have unique characteristics, all of which we will delve deeper into. The following table will help you understand the debate of Tableau vs Excel and learn the differences between both software.
|
Parameters |
Tableau |
Excel |
|
Definition |
It is a visualisation tool used for detailed analysis. |
Excel is a spreadsheet application used to organise and format data. It deals with data transformations like calculations and manipulations using formulas. |
|
Usage |
Tableau is perfect for the quick and easy representation of data. |
Excel is considered suitable for storing data and statistical analysis. |
|
Security |
Tableau provides several options to secure data without scripting. |
In Excel, the in-built security features are weaker than in Tableau. |
|
User interface |
Due to its user-friendly interface, one can use Tableau with no prior knowledge of coding. |
To unleash the full potential of Excel as a tool, previous knowledge of Visual Basic (VB) and basic scripting is necessary. |
|
Data sources |
Tableau facilitates easy connection with a variety of sources in real-time. |
For Excel, plug-ins are necessary for non-Excel sources. |
|
Key features |
Tableau has a user-friendly, quick and interactive visualisation. It is powerful and intuitive and facilitates data joining, merging, and manipulation of large sets. |
Excel uses descriptive and manipulative statistics and facilitates multi-layered calculations on data using in-built functions. |
|
Benefits |
Tableau facilitates quick, interactive and appealing visualisations with big data. |
Excel facilitates convenient data transformation and manipulation when it comes to descriptive statistics. |
|
Performance |
Tableau is efficient and fast in performance even as the size of the data increases. |
When the data size increases, Excel finds it difficult to offer the same high-performance level. |
|
Integration |
Tableau offers the feature of integration, which means it can be implemented with other applications. Tableau can be integrated with around 250 applications. |
Excel also offers the integration feature, but to a much more limited extent when compared to Tableau. Excel can only be integrated with about 60 applications. |
|
Combination of several types of charts |
Tableau allows one to combine several charts and build meaningful, interactive dashboards that facilitate additional analysis. |
Excel does not allow one to combine several types of charts simultaneously. |
|
Time-efficiency |
Even the most amateur Tableau users could save significant time if they transfer their pre-designed existing spreadsheets into the software. |
Uploading new data and updating visuals is more rapid in Tableau than in Excel. |
|
Business Purpose |
Tableau is at its most useful when working with big data. |
Excel is most useful when working to generate quick reports based on data. |
|
Application Users |
Data scientists and data analysts mostly use Tableau. |
Data analysts and developers mostly use Excel. |
|
Versions |
Tableau has multiple versions of desktop, server and is cloud-based. |
Organisations choose the version of Excel as per their needs and security considerations since it is a Microsoft-licensed software with office tools. |
|
Field |
Tableau is used to its fullest in business evaluations and key performance metrics. |
Excel can be used in several domains that deal with data transformations and manipulations. |
|
Solution |
Analysis of the big data problems is represented in Tableau. |
Excel is best applicable and most suited for small-scale and structured data. |
|
Automatic Refreshing |
Automatic refreshing of Tableau applications is easy as the tool is intuitive, allowing recurring processes to be created. Custom formulas can also be applied. |
Automatic refreshing Excel worksheets need the creation of macros of manual programming methods, which becomes difficult. |
Unlock your full potential with our Microsoft Excel Masterclass and become a spreadsheet virtuoso today!
Can Tableau and Excel be used together?
Is Tableau better than Excel? Or is Excel better than Tableau? The debate of Excel vs Tableau is an on-going one and determining which is better depends on several factors. A concrete answer to these questions depends on the purpose you are using it to achieve. While tens of thousands of companies use Tableau to see and understand their data, many organisations also use Excel, which has been the dominant spreadsheet software for decades. While Excel allows its users to analyse data and perform calculations, Tableau leverages visual analytics and has revolutionised Tableau Data Visualisation.
Tableau users can interact with data to find insights faster and make better informed critical decisions. They can also better serve their customers and improve products.
Supercharge your skills with our Microsoft BI Training and unlock the power of Business Intelligence reporting.
Conclusion
Many people often say that Tableau and Excel are mostly the same in terms of need and usage, but this is not the case. Both can perform similar functionalities to a certain extent. However, one is forced to pick between the two whenever specific needs are considered. However, different companies will introduce various visualisation tools to the market every year, and industries cannot just stick to one particular tool for data analytics purposes. Instead of Tableau vs Excel, organisations should consider the prospect of Tableau and Excel. Implementing the tools together offers plenty of advantages to an organisation.
Take your Business Intelligence to new heights with expert training from our Business Intelligence Reporting Courses.
Frequently Asked Questions
Why do companies use Tableau?

Companies opt for Tableau due to its intuitive interface and capacity to generate insightful data representations. Essentially, Tableau helps Data Scientists or Business Analysts enhance their company's decision-making. In addition, it facilitates efficient data loading, analysis and clear presentation for stakeholders.
Does Tableau have a row limit like Excel?

Unlike Excel, Tableau doesn’t have any limit for rows. Using Tableau aids professionals save their time and instead draw their attention to the data that matters. Moreover, Tableau might have numerous advantages over Excel.
What are the other resources and offers provided by The Knowledge Academy?

The Knowledge Academy takes global learning to new heights, offering over 3,000 online courses across 490+ locations in 190+ countries. This expansive reach ensures accessibility and convenience for learners worldwide.
Alongside our diverse Online Course Catalogue, encompassing 19 major categories, we go the extra mile by providing a plethora of free educational Online Resources like News updates, Blogs, videos, webinars, and interview questions. Tailoring learning experiences further, professionals can maximise value with customisable Course Bundles of TKA.
What is the Knowledge Pass, and how does it work?

The Knowledge Academy’s Knowledge Pass, a prepaid voucher, adds another layer of flexibility, allowing course bookings over a 12-month period. Join us on a journey where education knows no bounds.
What are related courses and blogs provided by The Knowledge Academy?

The Knowledge Academy offers various Business Intelligence Reporting Courses, including the Microsoft Power BI Course, Tableau Desktop Training, and DAX Training. These courses cater to different skill levels, providing comprehensive insights into the SketchUp Tools for 3D Design.
Our Office Application Blogs cover a range of topics related to Tableau, offering valuable resources, best practices, and industry insights. Whether you are a beginner or looking to advance your Office Application skills, The Knowledge Academy's diverse courses and informative blogs have got you covered.
Upcoming Office Applications Resources Batches & Dates
Date
 Tableau Desktop Training
Fri 7th Mar 2025
Fri 23rd May 2025
Fri 18th Jul 2025
Fri 12th Sep 2025
Fri 12th Dec 2025


 Top Rated Course


 If you wish to make any changes to your course, please


