


 Top Rated Course


We may not have the course you’re looking for. If you enquire or give us a call on +44 1344 203 999 and speak to our training experts, we may still be able to help with your training requirements.
DataDog vs Grafana: A Detailed Comparison
Sophia Ellis 07 December 2023Explore the intricate differences between DataDog and Grafana in this comprehensive blog. From monitoring capabilities to user interfaces, delve into the distinct features that set these two tools apart in the dynamic landscape of data visualisation and analysis.

Training Outcomes Within Your Budget!
We ensure quality, budget-alignment, and timely delivery by our expert instructors.
Table of Contents
Navigating the horizon of monitoring and observability tools presents a critical decision for organisations, while they figure out the Datadog vs Grafana conundrum. The distinctive features of these two platforms, shows their prominence in the domain of real-time insights and Data Analytics.
Whether you are seeking the streamlined efficiency of Datadog's integrated approach or the unparalleled customisation of Grafana's open-source flexibility, understanding the nuances of these solutions is paramount for making informed choices in IT monitoring. This blog will help you know the distinctions between Datadog vs Grafana, an all-in-one cloud monitoring solution, and a flexible visualisation platform integrated together with various data sources.
Table of Contents
1) What is Grafana?
2) What is DataDog?
3) Datadog vs Grafana comparison
4) Conclusion
What is Grafana?
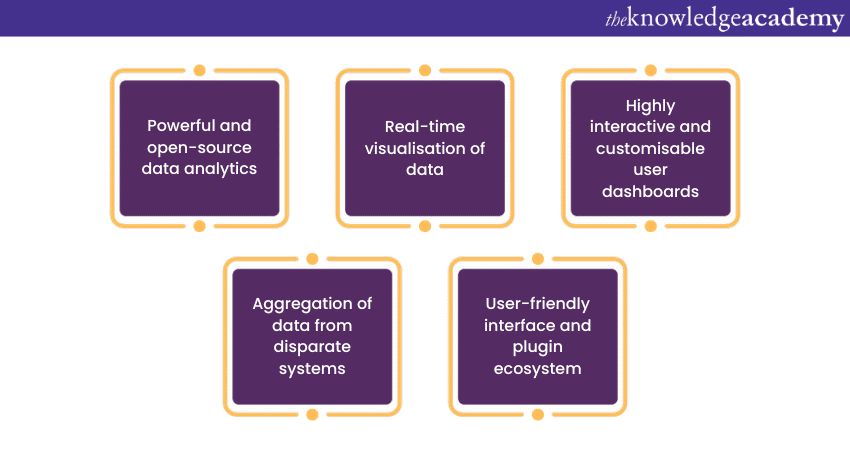
Grafana is a powerful and versatile open-source analytics and monitoring platform that has gained widespread popularity for its ability to visualise and analyse data from multiple sources in real-time.
Originally developed in 2014 as a dashboard and Data Visualisation tool, Grafana has evolved into a comprehensive observability solution used by organisations across the globe.
At its core, Grafana enables users to create highly interactive and customisable dashboards, making it an ideal choice for monitoring and visualising complex systems and applications. Its strength lies in its support for a wide array of data sources, including popular databases like Graphite, Prometheus, InfluxDB, Elasticsearch, and many others.
It is this flexibility that allows Grafana to aggregate data from disparate systems, providing a unified view of an organisation's infrastructure. Now one of Grafana's key features is its ability to connect to various data repositories, allowing users to create visually appealing graphs, charts, and alerts based on real-time metrics and logs.
Its user-friendly interface and extensive plugin ecosystem make it accessible to both technical and non-technical users, fostering collaboration across teams.
Whether used for infrastructure monitoring, application performance tracking, or log analysis, Grafana's adaptability and community-driven development continue to make it a preferred choice for those seeking a robust and customisable observability platform.

Advantages of Grafana
Here are the various advantages to using Grafana, have a look:
a) Open-source flexibility: Grafana's open-source nature allows for customisation and adaptation to specific organisational needs without the constraints of proprietary software.
b) Versatile data source support: Grafana supports a wide array of data sources, including popular databases like Graphite, Prometheus, InfluxDB, Elasticsearch, and more.
c) Intuitive dashboard creation: Grafana excels in providing a user-friendly interface for creating visually appealing and interactive dashboards. Users can effortlessly design and customise dashboards, arranging metrics, charts, and logs to suit their specific monitoring needs.
d) Rich visualisation options: Grafana offers a plethora of visualisation options, from traditional graphs and charts to heatmaps, gauges, and histograms.
e) Community-driven ecosystem: Being open source has fostered a vibrant and active community around Grafana. This community contributes to the platform's development, creating a wealth of plugins and extensions.
Ace Your Next Interview with These Top Grafana Interview Questions!
Disadvantages of Grafana
Here are the various disadvantages to using Grafana, have a look:
a) Steeper learning curve: Grafana, with its extensive customisation options and feature-rich environment, may present a steeper learning curve for users who are new to the platform.
b) DIY configuration complexity: While Grafana's flexibility is a strength, it can also be a potential drawback for users who prefer out-of-the-box solutions.
c) Enterprise feature costs: While Grafana itself is open-source and free, certain enterprise features and additional functionalities may come with associated costs.
d) Resource intensiveness: Grafana's resource requirements can be demanding, especially when dealing with large datasets or when deploying in resource-constrained environments. This can result in increased hardware costs and infrastructure complexity.
e) Limited native data storage: Grafana itself does not provide native data storage capabilities, relying on external data sources to retrieve and display information. While this approach ensures flexibility, it may pose challenges for users who prefer an all-in-one solution.
Discover What Grafana Is and How It Transforms Data Visualization!
What is DataDog?
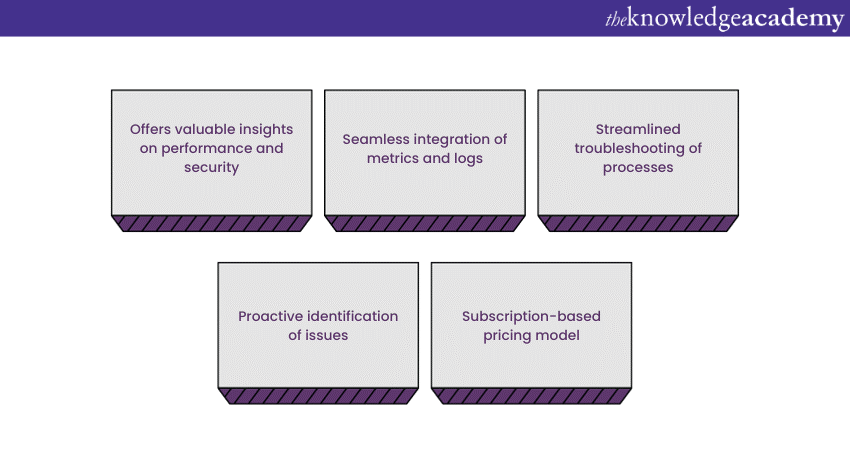
Datadog stands out as a leading cloud monitoring and observability platform designed to provide comprehensive insights into the performance, availability, and security of applications and infrastructure.
Founded in 2010, DataDog has become a go-to solution for organisations seeking unified monitoring across a diverse technology stack. At its core, DataDog offers a centralised platform that seamlessly integrates metrics, traces, and logs, providing a holistic view of an organisation's IT environment.
This unified approach streamlines troubleshooting processes and enables proactive identification of potential issues. DataDog excels in its user-friendly interface, making it accessible to both technical and non-technical users, fostering collaboration across teams.
The platform's robust features include automated anomaly detection, customisable dashboards, and powerful alerting capabilities. DataDog supports a vast ecosystem of integrations, covering cloud providers, databases, containers, and more, allowing users to monitor and correlate data from various sources.
DataDog's strength also lies in its scalability, making it suitable for startups as well as large enterprises. The platform's pricing model typically revolves around a subscription-based structure, with costs based on the volume of resources being monitored.
Manage and deploy your cloud solutions by signing up for our Cloud Computing Training now!
Advantages of Datadog
Here are the various advantages to using Datadog, have a look:
a) Unified monitoring platform: Datadog serves as an integrated monitoring platform, providing end-to-end visibility into the performance of applications, infrastructure, and logs.
b) Ease of use: Known for its user-friendly interface, Datadog ensures a smooth onboarding experience.
c) Extensive integrations: Datadog boasts a vast ecosystem of out-of-the-box integrations. Covering cloud providers, databases, containers, and more.
d) Real-time visibility: Datadog excels in providing real-time visibility into metrics, traces, and logs. The platform's ability to correlate data from different sources enables users to gain timely insights, making it easier to identify issues and optimise performance.
e) Pre-built dashboards: Datadog offers pre-built dashboards that cater to common monitoring needs. These ready-to-use dashboards provide users with a quick and convenient way to visualise key metrics and facilitate rapid decision-making.
Grafana vs Kibana: Which Tool Fits Your Data Visualization Needs?
Disadvantages of Datadog
Here are the various disadvantages to using Datadog, have a look:
a) Cost structure: Datadog's pricing model, based on the volume of monitored resources, can lead to higher costs as organisations scale.
b) Complexity for small environments: While Datadog is highly scalable, its extensive feature set and pricing structure may be more complex than necessary for smaller environments.
c) Learning curve: The robustness of Datadog's features comes with a learning curve. New users, especially those unfamiliar with sophisticated monitoring tools, may find it challenging to navigate the platform and harness its full potential.
d) Dependency on external systems: Datadog relies heavily on integrations with external systems for various functionalities, such as log management and specific data sources.
e) Resource usage: Datadog's resource usage, particularly in terms of memory and CPU, can be significant, especially in larger environments.
Explore the Best Grafana Alternatives for Your Monitoring Needs!
Datadog vs Grafana comparison
Below are the various aspects that distinguish Datadog vs Grafana, have a look:
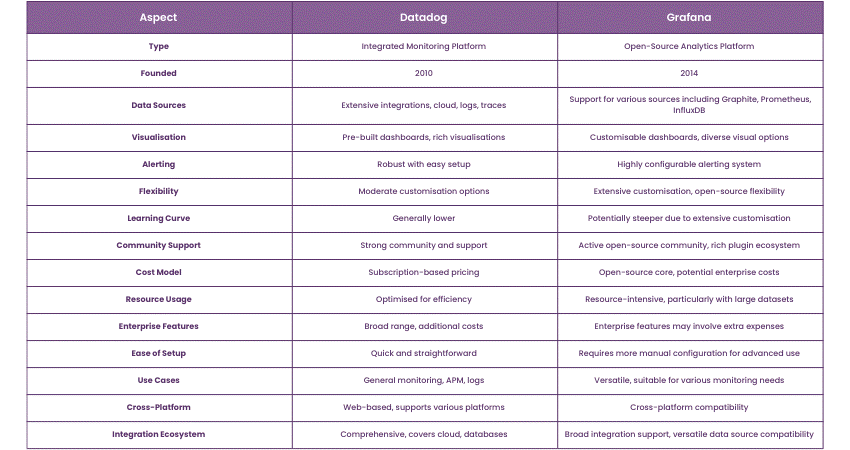
In the domains of monitoring and observability, Datadog and Grafana stand out as two prominent solutions, each offering unique features and capabilities. Having a well-versed understanding of the distinctions between these platforms is crucial for organisations seeking the most suitable tool for their monitoring needs. Here are the various distinctions enlisted as follows:
Harness the potential of cloud-based resources by signing up for our Google Cloud Compute Engine Training now!
Datadog: Unified monitoring leader
Datadog, founded in 2010, has established itself as a comprehensive and integrated monitoring platform. One of its standout features is the ability to provide end-to-end visibility into the performance of applications, infrastructure, and logs. Datadog's strength lies in its user-friendly interface and extensive out-of-the-box integrations, which facilitate a quick and streamlined setup. It excels in unifying metrics, traces, and logs, offering a cohesive view for efficient troubleshooting and optimisation.
Grafana: Customisable open-source solution
In contrast, Grafana, founded in 2014, emerged initially as an open-source dashboard and visualisation platform. Over time, it has evolved into a versatile observability solution known for its customisation options.
Grafana's strength lies in its adaptability and flexibility, allowing users to create highly interactive dashboards tailored to their specific needs. While this customisation potential brings forth a steeper learning curve, it empowers users to craft visualisations that suit their unique requirements.
Choosing the right fit: considerations and trade-offs
Selecting between Datadog and Grafana depends on needs and preferences. Datadog excels with quick setup and out-of-the-box features, ideal for simplicity. Grafana, favoured for customisation and open-source adaptability, suits complex monitoring needs. Decisions hinge on factors like ease of use, customisation, integration, and budget.
Monitor your data logs and infrastructure by signing up for our Grafana Training now!
Conclusion
In monitoring solutions, the choice between Datadog vs Grafana hinges on specific organisational needs. Datadog excels in simplicity, while Grafana offers customisation. Both platforms, with their unique strengths, cater to diverse monitoring requirements, ensuring a comprehensive approach to observability in modern IT environments.
 If you wish to make any changes to your course, please


