


 Top Rated Course

We may not have the course you’re looking for. If you enquire or give us a call on +44 1344 203 999 and speak to our training experts, we may still be able to help with your training requirements.
What is Tableau CRM (CRM Analytics)? A Full Guide
Scarlett Adams 27 March 2025Tableau is a powerful Salesforce tool that has several features like data integration capabilities, dashboard creation, Data Analysis, and collaborative insights. Read this blog to learn about Tableau CRM to make data-driven decisions. Also, explore the various features and benefits of this tool in detail.
Training Outcomes Within Your Budget!
We ensure quality, budget-alignment, and timely delivery by our expert instructors.
Imagine transforming your raw data into a masterpiece of insights. With Tableau, a powerful tool within the Salesforce ecosystem, you can do just that. From data integration and dashboard creation to in-depth Data Analysis and collaborative insights, Tableau CRM equips you with everything you need to make informed, data-driven decisions.
Dive into this blog to discover how Tableau CRM can revolutionise your business processes, offering detailed features and unparalleled benefits.
Table of contents
1) What is Tableau CRM in Salesforce?
2) Benefits of Tableau CRM
3) Tableau and Tableau CRM: What’s the difference?
4) How to use Tableau CRM for your business?
5) How does Tableau CRM get the Data?
6) Tableau CRM terms explained
7) Conclusion
What is Tableau CRM in Salesforce?
Tableau CRM, formerly known as Einstein Analytics, is a valuable Business Intelligence and data visualisation tool integrated into the Salesforce ecosystem. It enables organisations to extract valuable insights from their vast amounts of data, empowering them to make informed decisions and drive business growth.
As part of the Salesforce suite of products, Tableau CRM seamlessly integrates with other Salesforce tools, allowing users to leverage the full power of their Salesforce data. By combining the capabilities of Salesforce’s Customer Relationship Management (CRM) platform with Tableau’s advanced analytics and visualisation capabilities, it offers a comprehensive solution for data analysis and reporting.
Benefits of Tableau
Here are a few main benefits of Tableau:
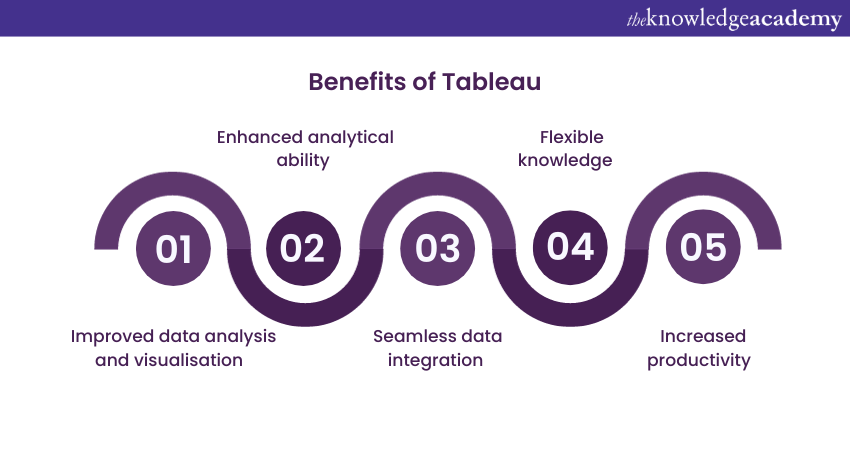
1) Improved data analysis and visualisation
Tableau within Salesforce allows you to create interactive dashboards and worksheets that display your data clearly and engagingly. You can spot patterns and trends that were hidden before easily and use them to make smarter decisions throughout the sales cycle. Whether you need to track prospecting, pipeline coverage, account management, or any other aspect of your business, Tableau can help you visualise it all.
2) Enhanced analytical ability
Salesforce Tableau CRM has a user-friendly interface that lets anyone access and analyse data without technical skills. You can use Tableau to explore your data from different perspectives and discover insights that can drive better outcomes for your company. Tableau also helps you share your findings with others across the organisation and align your goals with the company vision.
3) Seamless data integration
Data integration is another key feature of Salesforce Tableau CRM. Unlike Salesforce alone, which has some limitations when combining data from different sources, Tableau can seamlessly blend data from various modules into one chart or dashboard. This way, you can have a holistic view of your pipeline growth and marketing engagements at any time, regardless of where they come from.
4) Flexible knowledge
Sharing Salesforce reporting is based on Salesforce data only, which means it cannot be used as a standard tool for all departments in the company. It also has some data restrictions that may not suit your needs. Conversely, Tableau has no data limitations, so it can be used as a common language for all stakeholders in the organisation. You can use Tableau to create relevant reports for finance, operations, or executive teams and share them easily across platforms.
5) Increased productivity
Salesforce with Tableau leverages Salesforce’s rich customer data and brings analytics to life for every individual in the organisation. Collecting department reports on one page can save time and get an updated analysis of different customer segments. You can also access the data on your system or mobile devices anytime and anywhere, making it easier to understand the data at any moment.
Enhance your Business Intelligence skills today – Join our Business Intelligence Reporting Course!
Tableau and Tableau CRM: What’s the difference?
Tableau is a leading data visualisation platform offering various products for different needs. Tableau CRM is one of these products, and it has some unique features that make it suitable for companies that use Salesforce as their CRM system. Here are some of the main differences between Tableau and Tableau CRM:
a) Tableau is a standalone platform that can be installed on-premises or hosted in the cloud. It allows users to create creative and interactive dashboards and worksheets that display data from various sources. Users need a license to access Tableau dashboards, regardless of their location. Tableau is ideal for companies that want a comprehensive BI solution that can handle remote and federated queries.
b) Tableau CRM is a product within the Tableau platform that integrates with Salesforce CRM. It enables users to embed AI and Machine Learning features into their reporting and CRM using Einstein Analytics. It also provides templated apps that can be customised to meet specific analytics needs using Salesforce data. Users can access Tableau CRM dashboards directly from Salesforce and perform actions based on the analytics results.
Discover the Pros and Cons of Tableau! Maximize Your Data Strategy with Informed Choices.
How to use Tableau CRM for your business?
Tableau CRM is a product that connects to Salesforce and external data from one place to provide AI-powered insights and recommendations for better business outcomes. Some of the ways to use Tableau CRM are:
a) Pipeline Analytics: This is a feature that helps sales teams manage their pipeline, forecast revenue, and optimise performance. Pipeline Analytics allows users to create dashboards and reports that show key metrics such as pipeline health, conversion rates, win rates, and deal size. Users can also drill down into the details of each opportunity, stage, and account to identify risks and opportunities. Pipeline Analytics also leverages AI to provide predictive and prescriptive guidance on the best actions to take, such as which deals to focus on, which products to cross-sell, and which discounts to offer.
b) Service Analytics: This is a feature that helps service teams to improve customer satisfaction, retention, and loyalty. Service Analytics enables users to monitor and analyse key service metrics such as case volume, resolution time, customer effort score, and satisfaction score. Users can also explore the root causes of customer issues, identify trends and patterns, and discover areas for improvement. Service Analytics also uses AI to provide proactive and personalised solutions for customers, such as recommending the best channel, agent, and offer for each case.
c) B2B Marketing Analytics: This is a feature that helps marketing teams measure and optimise their campaigns, programs, and channels. B2B marketing analytics allows users to track and visualise the performance of their marketing activities, such as email, web, social, and events. Users can also segment and profile their leads and accounts, understand their buyer journey, and calculate their return on investment. B2B marketing analytics also applies AI to generate insights and recommendations for marketers, such as which campaigns to prioritise, which content to create, and which audiences to target.
Brush up on Interview skills with Tableau Interview Questions and Answers.
How does Tableau CRM get the Data?
There are several options for leading data into Tableau CRM using connectors. You can connect data to external applications, databases, and data warehouses, or to any application outside or inside your Salesforce org.
The various connectors help to bring your data into one place so you can analyse and share it with any Salesforce user. If your organisation handles sensitive data, you can make sure that the objects and fields holding that information are not being extracted to Tableau CRM.
Create Stunning Stacked Bar Charts in Tableau—Start Visualizing Your Data Now!
Tableau CRM terms explained
Tableau CRM is a product that integrates with Salesforce CRM and allows you to create and share interactive dashboards and worksheets that display your data clearly and engagingly. Tableau CRM uses some terminology that may be unfamiliar to you at first. Here are five terms that you need to know:
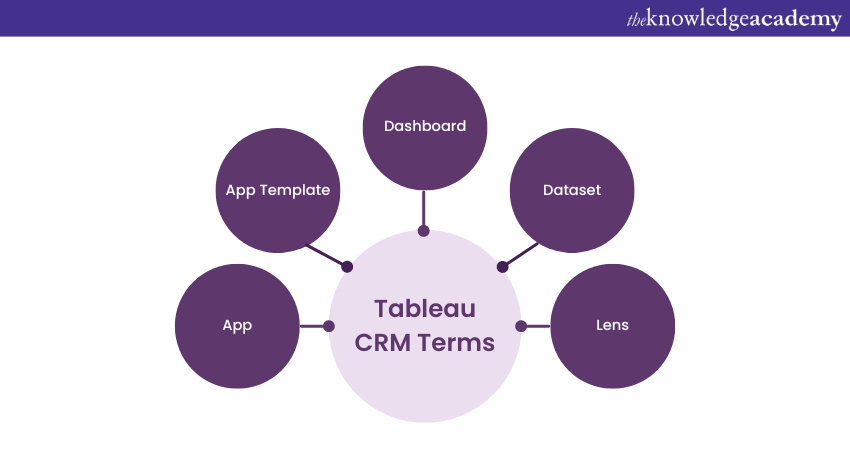
App
An app is the core component of Tableau CRM. It is like a folder in Salesforce reporting, as it can store multiple items, such as lenses, dashboards, and datasets. You can create different apps for different projects, departments, or teams and control who can access them.
App Template
An app template is a prebuilt analytics app for some common use cases and departments using Salesforce. It is useful for companies new to Tableau CRM and want to see some quick results immediately.
App templates are generic and have few customisations in their Salesforce environment. They also provide an overview of the insights you can see and the Salesforce objects that drive them. This helps you understand the questions your dashboard can help answer.
Unlock the Full Potential of Tableau for Your Business Analytics. Get Started Today!
Dashboard
A dashboard is similar to a native Salesforce dashboard in its structure but much more powerful in functionality. A dashboard comprises charts, metrics, and tables showing your data insights. Tableau CRM dashboards have additional features like Interactions, Faceting, and Filtering that help you explore your data from different perspectives.
Dataset
A dataset collects relevant data stored in a denormalised form to optimise interactive exploration. This format improves query speed and performance, as it does not require normalisation or data deduplication (as some Salesforce reports do). You can also combine different data sources into a single dataset to ensure your data is consistent.
Boost Your Dashboard Functionality with Action Filters in Tableau. Explore Now!
Lens
A lens is similar to a native Salesforce report in terms of its purpose but more flexible in design. A lens is used to explore the datasets you have built for specific business needs. You can save lenses separately or add them to dashboards to tell a story across multiple lenses and data sources.
Learn how to create insightful reports with our comprehensive Microsoft Power BI Course!
Conclusion
We hope that this blog has helped you understand what is Tableau CRM. It is a product that integrates with Salesforce CRM and help you to create and share interactive dashboards and worksheets that display your data clearly and engagingly. It is used to gain valuable insights into the various aspects of your business, such as sales pipelines, service performance, and marketing campaigns. Tableau CRM can track your progress, identify opportunities, measure customer satisfaction, and optimise your strategies.
Boost your Data Visualisation skills with our Tableau Desktop Training.
Frequently Asked Questions
Is Tableau the same as Salesforce?
No, Tableau is not the same as Salesforce. Tableau is a visual analytics platform for Data Visualisation and business intelligence, while Salesforce is a comprehensive cloud computing service specialising in customer relationship management (CRM).
Does Tableau have a future?
Yes, Tableau has a promising future. As businesses increasingly depend on data to drive decisions, Tableau's powerful Data Visualisation tools are crucial. Its ongoing integration with Salesforce also expands its abilities, making it an essential tool for data-driven insights.
What are the other resources and offers provided by The Knowledge Academy?
The Knowledge Academy takes global learning to new heights, offering over 3,000 online courses across 490+ locations in 190+ countries. This expansive reach ensures accessibility and convenience for learners worldwide.
Alongside our diverse Online Course Catalogue, encompassing 19 major categories, we go the extra mile by providing a plethora of free educational Online Resources like News updates, Blogs, videos, webinars, and interview questions. Tailoring learning experiences further, professionals can maximise value with customisable Course Bundles of TKA.
What is the Knowledge Pass, and how does it work?
The Knowledge Academy’s Knowledge Pass, a prepaid voucher, adds another layer of flexibility, allowing course bookings over a 12-month period. Join us on a journey where education knows no bounds.
What are the related courses and blogs provided by The Knowledge Academy?
The Knowledge Academy offers various Business Intelligence Reporting Courses, including MicroStrategy 10 Training and Microsoft Power BI Training. These courses cater to different skill levels, providing comprehensive insights into Data Visualisation with Tableau.
Our Office Application Blogs cover a range of topics related to Tableau, offering valuable resources, best practices, and industry insights. Whether you are a beginner or looking to advance your Business Intelligence Reporting skills, The Knowledge Academy's diverse courses and informative blogs have you covered.
Upcoming Office Applications Resources Batches & Dates
Date
 Tableau Desktop Training
Tableau Desktop Training
Fri 23rd May 2025
Tableau Desktop Training
Fri 25th Jul 2025
Tableau Desktop Training
Fri 26th Sep 2025
Tableau Desktop Training
Fri 28th Nov 2025
 If you wish to make any changes to your course, please


