We may not have the course you’re looking for. If you enquire or give us a call on +352 8002-6867 and speak to our training experts, we may still be able to help with your training requirements.
Training Outcomes Within Your Budget!
We ensure quality, budget-alignment, and timely delivery by our expert instructors.

In Data Analysis, knowing your Data Types is like having a secret key to Tableau, the powerful visualisation tool. Think of Data Types in Tableau as the magic behind how Tableau stores, organises and digs deep into your data to make sure what you see is spot-on.
According to Tableau's official website, Tableau is widely adopted by organisations, with over 100,000 customer accounts and millions of users worldwide. In this blog,we’ll unwrap the essentials of Data Types in Tableau, shedding light on why they’re so crucial and how they can make your data work wonders.
By mastering Data Types in Tableau, you’re setting yourself up for success, turning data chaos into clear insights that can guide your decisions. So, let’s get you up to speed and transform the way you analyse data with Tableau!
Table of Contents
1) What are Data Types?
2) Different Data Types in Tableau
3) Choosing the Right Data Type
4) Managing Data Types in Tableau
5) How do you change data types in Tableau?
6) Conclusion
What are Data Types?
Data Types are fundamental components in Tableau that define the nature and characteristics of the data being analysed. In essence, they specify how Tableau interprets and handles different types of data values. Each Data Type has distinct properties and behaviours that influence how the data is stored, sorted, aggregated, and visualised within Tableau.
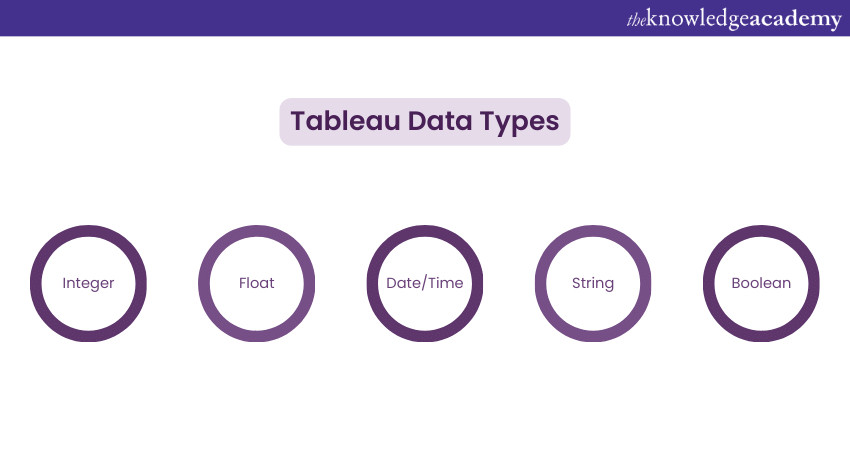
There are different Data Types in Tableau to accommodate various data formats and structures. These include:
a) Numeric Data Types, such as Integers and Floats, which are used for mathematical calculations and aggregations. Date and Time Data Types enable the analysis of temporal trends and patterns. This allows for precise filtering and sorting based on dates and durations.
b) String Data Types store textual information, such as names and descriptions, facilitating dimension analysis and categorical representations.
c) Boolean Data Types, which store binary values (True or False) and are useful for creating filters and conditional calculations.
Understanding Data Types is crucial for accurate data representation, efficient performance, and effective analysis in Tableau. By selecting the appropriate Data Types for your data sets, you can ensure that Tableau processes and displays your data accurately, leading to more meaningful insights and visualisations.
Different Data Types in Tableau
In this section of the blog, we will understand in detail what are the different Data Types in Tableau. Understanding the common Tableau Data Types available in Tableau will enable you to make informed decisions when working with your datasets. Here are some of the frequently used Tableau Data Types:

a) Integer: Integer Data Types represent whole numbers without decimal places. They are suitable for storing numerical values that do not require fractional precision. Integers are often used for counting, indexing, and performing mathematical calculations and aggregations.
b) Float: Float Data Types are used to represent decimal numbers. They offer greater precision compared to integers and are suitable for data that requires fractional values. Floats are commonly employed for financial data, scientific measurements, and any data that necessitates decimal accuracy.
c) Date/Time: Tableau provides various Data Types to handle date and time information. These include date, time, datetime, and duration. Date Data Types enable the analysis of trends and patterns over time, while time Data Types facilitate precise tracking of events. Datetime Data Types combine both date and time information. Duration Data Types allow for the measurement and calculation of time intervals. These Data Types are invaluable for time series analysis, scheduling, and tracking temporal relationships.
Prepare and clean your data effortlessly—Master Tableau Prep today!
d) String: String Data Types are used to store textual information, such as names, addresses, and descriptions. They are versatile and suitable for categorical data or dimensions. String Data Types support various operations, including concatenation, substring extraction, and pattern matching, which can be leveraged for data transformations and analysis.
e) Boolean: Boolean Data Types store binary values, typically represented as True or False. They are useful for creating filters, conditional calculations, and logical operations. Boolean Data Types are particularly handy for evaluating conditions and creating dynamic calculations based on specific criteria.
Understanding and utilising these common Data Types in Tableau will empower you to accurately represent and analyse your data, leading to more meaningful and insightful visualisations.
Transform your business with powerful insights! Elevate your reporting capabilities with our Business Intelligence Training.
Choosing the Right Data Type
Choosing the right Data Type is a crucial step in Tableau as it directly impacts the accuracy of data representation and the efficiency of Data Analysis. Here are some key considerations to keep in mind when selecting Data Types in Tableau:
a) Data integrity: Ensure that the chosen Data Type aligns with the inherent characteristics of your data. For example, if you are working with date values, it is preferable to use the date Data Type rather than storing them as strings. Using appropriate Data Types ensures data integrity, improves sorting capabilities, and allows for accurate filtering and aggregation.
b) Efficiency: Consider the efficiency of the Data Type in terms of memory usage and computational performance. For large datasets, selecting a Data Type that minimises memory footprint can significantly improve Tableau's processing speed. For instance, if your data does not require decimal precision, using an integer Data Type instead of a float can save memory space.
c) Data Analysis requirements: Analyse the specific goals and requirements of your Data Analysis. Different Data Types offer varying levels of precision and suitability for calculations and aggregations. For numeric data, choose Data Types that provide the necessary level of accuracy. For example, if you need to perform complex calculations involving decimal places, a float Data Type may be more appropriate than an integer.
d) Compatibility: Consider the compatibility of the chosen Data Type with other data sources or databases that you might be using alongside Tableau. Ensure that the Data Type aligns with the expectations and requirements of your data ecosystem. Mismatches in Data Types can lead to errors or unexpected behaviour during data integration and analysis.
e) Consider data context: Take into account the context in which the data will be used and visualised. For example, if you have a categorical variable with a limited number of distinct values, using a string Data Type might be more appropriate than an integer. This choice will enable you to leverage Tableau's capabilities for categorical analysis and provide clear labels for your data.
By carefully considering these factors and selecting the most suitable Data Types in Tableau, you can ensure accurate data representation, optimise performance, and facilitate Effective Data Analysis and Visualisation. Remember that the right Data Type choice enhances the reliability and insights derived from your Tableau visualisations.
Ready to master Tableau Desktop and unlock the full potential of your Data Analysis? Join our comprehensive Tableau Desktop Training today!
Managing Data Types in Tableau
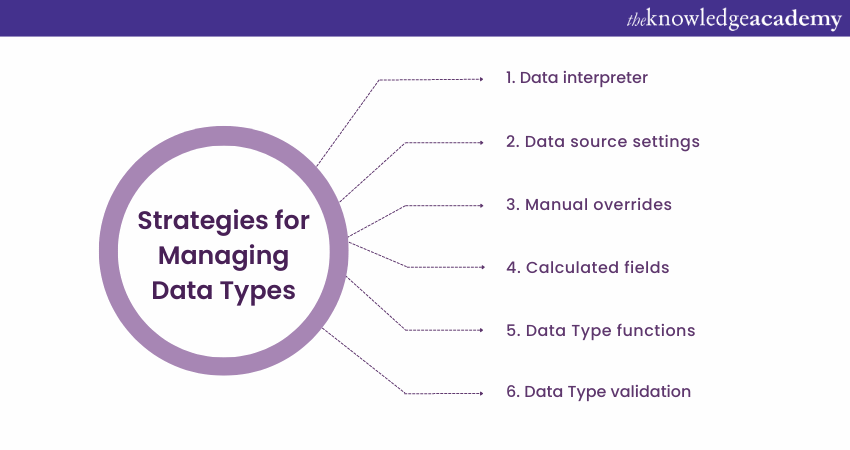
Managing Data Types effectively in Tableau is essential for ensuring accurate data representation, maintaining consistency, and optimising performance. Tableau provides several features and options to help manage Data Types efficiently. Here are some strategies for managing Data Types in Tableau:

a) Data interpreter: Tableau's Data Interpreter feature is designed to automatically detect and correct Data Type discrepancies during the data import process. It identifies inconsistencies and suggests appropriate Data Type assignments. Leveraging this feature can save time and effort by automatically resolving Data Type conflicts.
b) Data source settings: Tableau allows users to customise Data Types at the data source level. By accessing the Data Source tab and specifying Data Types explicitly, you can ensure consistent interpretations of data across all related visualisations and calculations. This feature is especially useful when working with multiple data sources that may have varying Data Type conventions.
c) Manual overrides: In certain cases, Tableau's automatic Data Type detection may not accurately capture the intended Data Type. In such scenarios, users can manually override the assigned Data Type for a specific field or column. This capability gives you precise control over the interpretation of your data, ensuring its alignment with your analysis requirements.
d) Calculated fields: Tableau's calculated fields offer flexibility in Data Type conversions and transformations. By creating calculated fields, you can manipulate Data Types to meet specific analysis needs. Tableau provides a range of functions and operators to facilitate Data Type conversions. For example, you can convert a string to a Date Type or perform mathematical operations on different numeric Data Types.
e) Data Type functions: Tableau provides functions that enable the explicit conversion between Data Types. Functions like INT, FLOAT, STR, and DATE can be used to convert values from one Data Type to another. Utilising these functions in calculated fields or data preparation steps can ensure consistency and accuracy in data representation.
f) Data Type validation: Regularly validate the Data Types of your fields and columns to identify any inconsistencies or unexpected changes. Tableau's data profiling and preview features can help you identify potential Data Type issues early on and take appropriate actions to address them.
By leveraging these features and practices, you can effectively manage Data Types in Tableau, ensuring consistent and accurate data representation, improving performance, and enabling more robust Data Analysis and Visualisation.
Looking for your next challenge? Apply for Tableau Developer roles now!
How do you change Data Types in Tableau?
Changing data types in Tableau is easy. You can do this using calculated fields or directly from inside the Data Source panel. Let us explore both methods.
Method 1: Changing Data Types in Data Source Panel
a) Open your tableau workbook:
Launch Tableau Desktop and open the workbook that has your data.
b) Navigate to the Data source pane:
The Data Source panel is located at the left part of this Tableau interface. If it is hidden, you can open it by clicking on the Data source tab at the bottom of your screen.
c) Identify the field:
In the Data Source pane, locate a field (column) whose data type you want to change.
d) Right-click on the field:
The right-clicking on the field name results in a context menu.
e) Choose Data Type:
When you hover over the "Data Type" option in the context menu, a submenu will appear. From here, choose the required type of data, such as Date Number or String.
f) Confirm changes:
Tableau will ask if you want to convert the data. Confirm the changes, and Tableau will automatically adjust the data type.
Unlock deeper insights with LOD in Tableau—Learn how today!"
Method 2: Using Calculated Fields
a) Open Calculated Field editor:
Select the drop-down arrow next to the data source and click "Create Calculated Field."
b) Write calculation:
Write a calculation to convert the data type in the calculated field editor. For example, to convert a field named "YourField" to a Date type, you can use a calculation like:
|
DATEPARSE("your_date_format," [YourField]) Replace "your_date_format" with the actual date format in your data. Click OK: |
After writing the calculation, click OK to create the calculated field.
c) Replace original field:
Replace the original field in your analysis with the newly created calculated field.
Example: Changing Date to String using Calculated Field
|
STR([YourDateField]) |
STR([YourDateField])
Replace "YourDateField" with the actual date field name. This calculation converts a date field to a string.
Example: Changing Number to Date using Calculated Field
|
DATEADD('day', [YourNumberField], #1899-12-30#) |
Replace "YourNumberField" with the actual number field name.
This calculation converts a number representing days since 1899-12-30 to a date.
By following these methods, you can easily change Data Types in Tableau based on your analysis requirements. Adjust the calculations and data types as needed for your specific use case.
Learn how to create insightful reports with our comprehensive Microsoft Power BI Course!
Conclusion
Understanding and effectively managing Data Types in Tableau is crucial for accurate data representation, optimal performance, and insightful Data Analysis. By choosing the right Data Types based on data characteristics, ensuring data integrity, and considering efficiency and analysis requirements, users can unlock the full potential of Tableau's visualisation capabilities.
Learn to build impactful Tableau charts—Turn your data into insights!
Frequently Asked Questions

Tableau can connect to a wide array of data sources including Excel spreadsheets, SQL databases, Google Sheets, PDFs, and cloud services such as AWS, Google Cloud, and Azure.

Tableau supports various visualisations including bar charts, line graphs, pie charts, scatter plots, heat maps, tree maps, and more, enabling detailed and effective data representation and insights.

The Knowledge Academy’s Knowledge Pass, a prepaid voucher, adds another layer of flexibility, allowing course bookings over a 12-month period. Join us on a journey where education knows no bounds.

The Knowledge Academy takes global learning to new heights, offering over 30,000 online courses across 490+ locations in 220 countries. This expansive reach ensures accessibility and convenience for learners worldwide.
Alongside our diverse Online Course Catalogue, encompassing 17 major categories, we go the extra mile by providing a plethora of free educational Online Resources like News updates, Blogs, videos, webinars, and interview questions. Tailoring learning experiences further, professionals can maximise value with customisable Course Bundles of TKA.

The Knowledge Academy offers various Business Intelligence Reporting Courses, including Tableau Desktop Training, Microsoft Power BI Course and DAX Training Course. These courses cater to different skill levels, providing comprehensive insights into Data Visualisation with Tableau.
Our Office Applications Blogs cover a range of topics related to Data Analysis offering valuable resources, best practices, and industry insights. Whether you are a beginner or looking to advance your knowledge on Data Analysis, The Knowledge Academy's diverse courses and informative blogs have you covered.
Upcoming Office Applications Resources Batches & Dates
Date
 Tableau Desktop Training
Fri 24th Jan 2025
Fri 28th Mar 2025
Fri 23rd May 2025
Fri 25th Jul 2025
Fri 26th Sep 2025
Fri 28th Nov 2025


 Top Rated Course


 If you wish to make any changes to your course, please


