


 Top Rated Course

We may not have the course you’re looking for. If you enquire or give us a call on +44 1344 203 999 and speak to our training experts, we may still be able to help with your training requirements.
Microsoft Planner Gantt Chart: Optimize Your Projects
Sienna Roberts 05 September 2023Explore the power of project management with Microsoft Planner Gantt Chart. This versatile tool integrates seamlessly with Microsoft Planner, allowing you to create, view, and manage tasks in a visually intuitive Gantt chart format. Streamline your project planning, track progress, and meet deadlines effortlessly with the Microsoft Planner Gantt Chart feature.

Training Outcomes Within Your Budget!
We ensure quality, budget-alignment, and timely delivery by our expert instructors.
Table of Contents
A Gantt Chart is a graphical representation of a project's schedule. It shows tasks along a timeline, indicating when each task is planned to start and finish. Microsoft Planner Gantt Chart easily integrates this feature. It also provides an overview of your project's progress and schedule.
Elevate your project management with Microsoft Planner Gantt Charts. Efficiently plan, track, and collaborate for project success.
Table of Contents
1) Understanding the Microsoft Planner Gantt Chart
2) How to make a Gantt Chart in Microsoft Planner?
3) Benefits of Using Gantt Charts in Microsoft Planner
4) Using Gantt Charts in Microsoft Planner
5) Optimising Projects with Microsoft Planner Gantt Chart
6) Conclusion
Understanding the Microsoft Planner Gantt Chart
Gantt charts in Microsoft Planner offer a clear roadmap for your project. They help you see which tasks need to be done and when all on one timeline. This visual clarity is like a project GPS, guiding you and your team through each step.
One major advantage is spotting task overlaps and potential delays. With Gantt charts, you can identify if one task depends on another, making sure things happen in the right order. This prevents bottlenecks and keeps your project flowing smoothly.
You'll love how Gantt charts help with resource management too. You can see who's doing what and when, making sure no one's overloaded or sitting idle. This keeps everyone's skills in the game and the project on track.

How to make a Gantt Chart in Microsoft Planner?
Given below are the 10 steps you can follow to make a Gantt Chart in Microsoft Planner. It will make the process easy for you.
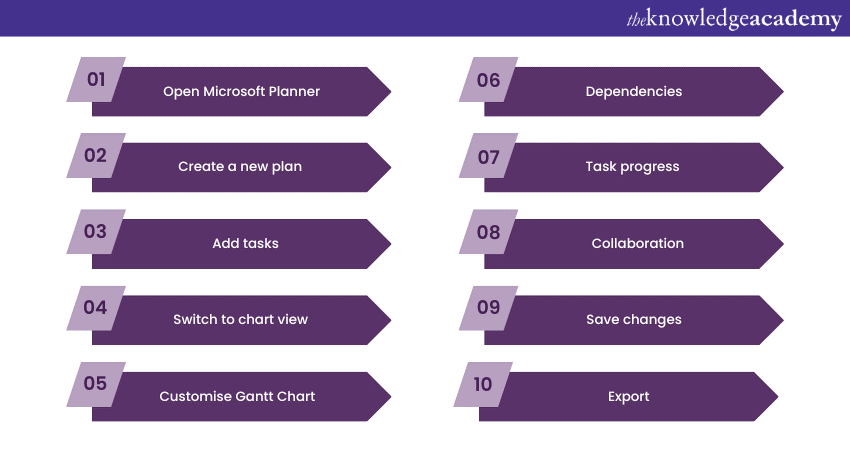
Open Microsoft Planner: Log in to your account and access the Planner tool.
Create a new plan: If you don't have a project plan yet, create a new one by clicking on the "+ New Plan" button.
Add tasks: Add tasks to your plan. Assign them to team members, set due dates, and add descriptions.
Switch to chart view: Click on the "Charts" tab at the top of the screen to switch to the Gantt chart view.
Customise Gantt Chart: In the Gantt chart view, you'll see your tasks displayed on a timeline. You can drag and drop tasks to adjust their start and end dates. Use the bars to modify task durations.
Dependencies: To set task dependencies, hover over a task bar until a handle appears, then drag it to another task's bar. This links the tasks in a sequence.
Task progress: Update task progress by clicking on a task bar and adjusting the completion percentage.
Collaboration: Team members can comment on tasks and communicate within Planner to keep everyone aligned.
Save changes: Your Gantt chart updates automatically as you make changes. There's no need to save separately.
Export: If needed, take snapshots or export the Gantt chart view for reporting or sharing purposes.
Benefits of using Gantt Charts in Microsoft Planner
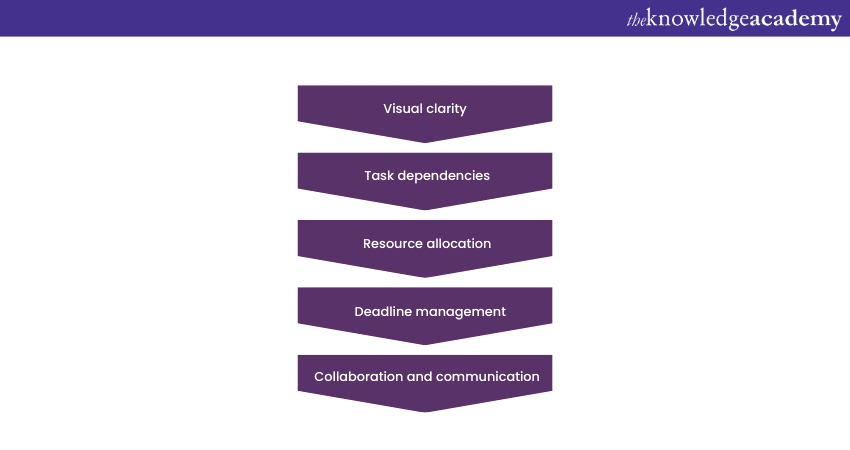
There are various benefits of using Gantt Charts in Microsoft Planner. From visual clarity to deadline management, the benefits are many. We will discuss it in this section.
Visual clarity
Gantt charts within Microsoft Planner offer a clear and direct visual representation of various project aspects. These charts display task timelines, dependencies, and progress in an easily understandable format. This allows both project managers and team members to instantly comprehend the project's structure and status without the need for complex interpretations.
Task dependencies
The Gantt chart feature in Microsoft Planner lets you establish specific task dependencies. This means you can clearly define which tasks need to be completed before others can commence. Such logical sequencing ensures a more streamlined project schedule. It minimises potential delays that could arise from tasks being out of order.
Resource allocation
Utilising the Gantt chart effectively aids in resource allocation. By pinpointing precisely when and where resources are required throughout the project's duration, you can ensure that workloads remain balanced. It makes sure that resources are optimally employed.
This is particularly useful for preventing resource overloads in specific phases of the project. It ultimately contributes to a smoother and more efficient workflow.
Deadline management
Gantt charts provided by Microsoft Planner serve as an effective tool for setting and monitoring task deadlines. This functionality is particularly advantageous in organising project tasks and ensuring that the project stays on course.
By assigning specific deadlines to individual tasks within the Gantt chart, project managers can create a structured timeline that guides the team's progress. As tasks are completed according to their set deadlines, the overall project advances smoothly.
Collaboration and communication
Integrating Gantt charts in Microsoft Planner makes team communication and collaboration much simpler. These charts provide a clear visual of the project's status, key milestones, and upcoming tasks. This removes confusion and misunderstandings that complex task lists or long discussions can create.
Team members can easily grasp the project's current position and what comes next, fostering unity and cooperation. Gantt charts' transparency encourages active participation and discussion. With everyone on the same page about project progress, teamwork improves, leading to better outcomes.
Discover the power of Microsoft SharePoint with expert training from The Knowledge Academy. Elevate your teamwork and productivity by joining Microsoft Sharepoint End User Fundamentals course now!
Using Gantt Charts in Microsoft Planner
Here we talk about the processes involved in using Gantt Charts in Microsoft Planner.
Creating a Project Plan
Start your project plan in Microsoft Planner by listing tasks and assigning start and end dates. The Gantt chart then takes shape, visually outlining your project's timeline and task interdependencies. This simplifies complex scheduling, granting you a comprehensive overview for efficient project management.
Setting dependencies
In Microsoft Planner, you can establish task relationships to outline the order in which tasks should unfold. By linking tasks together based on their interdependencies, you create a structured flow. This helps you maintain a steady momentum, progressing smoothly towards your goals.
Adjusting timelines
Maintaining agility in your project is essential. With Microsoft Planner's Gantt chart, you have the power to adjust task timelines effortlessly. By simply dragging and dropping tasks within the chart, you can adapt to changing project dynamics with ease. This flexibility empowers you to stay in control ensuring that your project stays on track.
Resource allocation
Efficiently managing your team's workload is crucial for project success. Within Gantt chart, you can allocate tasks by assigning them to specific team members. By keeping an eye on their availability right there on the chart, you ensure a balanced distribution of work.
This prevents any one person from being overwhelmed while others are underutilised. As a result, tasks progress smoothly, leading to optimal resource utilisation and a more streamlined project.
Monitoring Progress
Staying in the loop about your project's progress is essential. As tasks reach their finish lines, you can mark them as complete right on the chart. This real-time tracking provides you with an up-to-date snapshot of the project's status.
This empowers you to make informed decisions and evaluate the project's advancement accurately. The Gantt chart serves as your progress monitor, making sure you're always on top of your project's journey.
Master the art of efficient communication with our Microsoft Outlook Masterclass course. Sign up now!
Optimising Projects with Microsoft Planner Gantt Chart
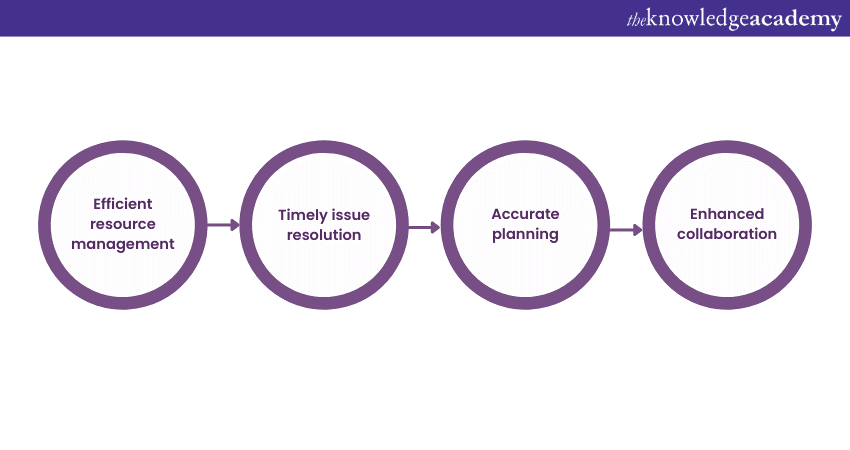
With the Gantt Chart, optimising projects have become easier than ever. In this section, we will discuss how it utilises skills of individuals effectively.
Efficient resource management
When it comes to managing your team's abilities, the Gantt Chart has your back. It lets you allocate tasks sensibly, preventing work overload for some and ensuring everyone's skills are effectively utilised. This balance enhances productivity and teamwork.
With a well-distributed workload, your project gains momentum and meets its goals. The Gantt chart acts like your co-pilot, guiding you towards resource management success.
Timely issue resolution
Gantt charts step in as problem-solvers, aiding in the early detection of obstacles. They're like early warning signs for project roadblocks. When you see these signs, you can fix things before they mess up your project's schedule.
This approach prevents disruptions and keeps your project moving smoothly towards completion. With Gantt charts on your side, you're able to foresee obstacles and take your project on the right course.
Accurate planning
Gantt charts provide a clear way to see how tasks are linked together. It helps you determine how long they realistically take, which helps a lot when you're planning a project carefully. This clear picture makes it easier to decide how much time and resources each task needs. So, you can feel sure about where you're putting your time and what you need to finish things the right way.
Enhanced collaboration
Gantt charts really help people work together better. They make it simple for everyone to know what they're supposed to do, what jobs are theirs, and how the project is going. This makes people work together more smoothly, avoiding confusion and making everything go better. When everyone's on the same page, the whole team works smarter and gets things done faster.
Conclusion
The Microsoft Planner Gantt chart is a strong tool that can really help you with your projects. It uses pictures to show tasks, how they're connected, and who's doing what. This helps you make your projects work better, make things easier, and get good results. So, try using Gantt charts in Microsoft Planner to make your project management even better.
Looking to master Microsoft Planner? Improve your skills with Microsoft Planner Training course from The Knowledge Academy
Frequently Asked Questions
Upcoming Office Applications Resources Batches & Dates
Date
 Microsoft Planner Training
Microsoft Planner Training
Fri 17th Jan 2025
Microsoft Planner Training
Fri 21st Mar 2025
Microsoft Planner Training
Fri 16th May 2025
Microsoft Planner Training
Fri 18th Jul 2025
Microsoft Planner Training
Fri 19th Sep 2025
Microsoft Planner Training
Fri 21st Nov 2025
 If you wish to make any changes to your course, please


