


 Top Rated Course

We may not have the course you’re looking for. If you enquire or give us a call on +44 1344 203 999 and speak to our training experts, we may still be able to help with your training requirements.
Power BI: Proven Best Practices for Effective Data Analysis and Visualisation
Sienna Roberts 20 November 2024Are you curious to learn about Power BI? Power BI is a powerful and reliable tool for optimising data visualisation, enhancing reporting frequency, and mastering advanced data analytics. Continue reading this informative blog to explore the Power BI Best Practices and how you can leverage these to your optimum potential.
Home
 Resources
Office Applications
Power BI: Proven Best Practices for Effective Data Analysis and Visualisation
Resources
Office Applications
Power BI: Proven Best Practices for Effective Data Analysis and Visualisation

Training Outcomes Within Your Budget!
We ensure quality, budget-alignment, and timely delivery by our expert instructors.
Table of Contents

In today’s world, businesses need insights to make smarter decisions. Microsoft’s Power BI is a powerful tool for visualising and analysing data. To get the most out of it, you need to follow Power BI Best Practices.
This blog will show you the key Power BI Best Practices, helping you create great reports and dashboards, ensure your data is accurate, and improve performance. We’ll cover everything from data modelling and visualisation techniques to data security and maintenance. These core practices will help you use Power BI effectively for your business.
Table of Contents
1) Data Preparation and Modelling
2) Effective Data Visualisation
3) Performance Optimisation
4) Power Bi Security
5) Deployment and Maintenance
6) Collaboration and Documentation
7) Conclusion
Data preparation and modelling
Data preparation and modelling serve as the cornerstone for successful data analysis in Power BI. These initial steps lay the foundation for robust reporting and visualisation. Here, we delve into the essential Power BI Best Practices for these crucial stages:
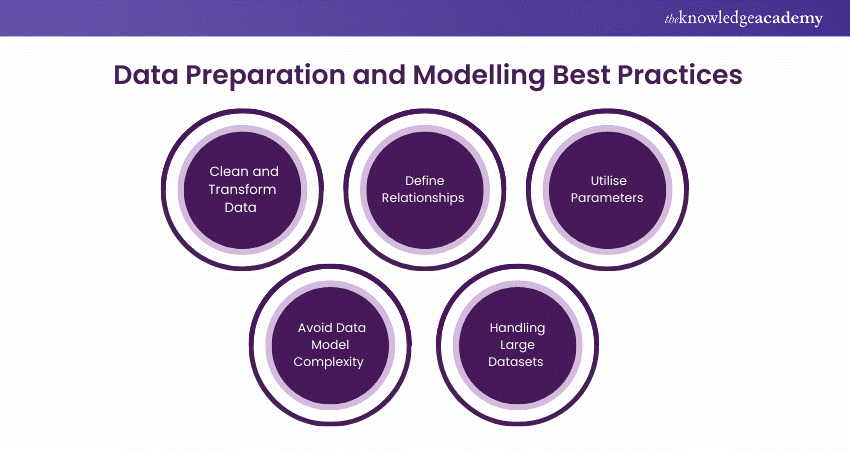
1) Clean and Transform Data
Before your data is ready for analysis, it often requires extensive cleaning and transformation. Power BI provides a user-friendly interface for data cleansing, enabling you to remove duplicates, handle missing values, and format data appropriately. By following best practices in data cleaning, you ensure that your visualisations are accurate and dependable.

2) Define Relationships
The establishment of clear relationships between tables underpins effective data modelling. Defining relationships in Power BI enables you to connect data from different sources and tables seamlessly. Adhere to best practices and establish relationships using appropriate fields, ensuring referential integrity.This ensures that your reports provide accurate insights by correctly linking data.
3) Utilise Parameters
Parameters in Power BI offer flexibility and customisation. By implementing parameters effectively, you can enable users to tailor reports to their needs. Power Bi Best Practices in parameter usage include creating dynamic date ranges, user-specific filters, and other interactive elements. Utilising parameters optimises user experience and makes reports more versatile.
4) Avoid data model complexity
While it's tempting to include all available data in your model, it's essential to avoid unnecessary complexity. Complex data models can lead to slower performance and confusion.
PowerBI Best Practices include focusing on relevant data, removing unused tables and columns, and maintaining a well-structured, streamlined model that enhances report efficiency.
5) Handling large datasets
In a data-driven world, working with substantial datasets is common. To ensure optimal performance, it's crucial to follow Power BI Best Practices when handling large datasets.
Techniques such as data aggregation, summarisation, and indexing play a pivotal role. Moreover, applying proper filters and query folding are vital strategies for managing large datasets without compromising report performance.
Discover the power of data insights with our Business Intelligence Analyst Course- register now!
Effective data visualisation
When using Microsoft Power BI, it’s essential for creating engaging reports and dashboards. In this part, we’ll look at key aspects of effective data visualisation:
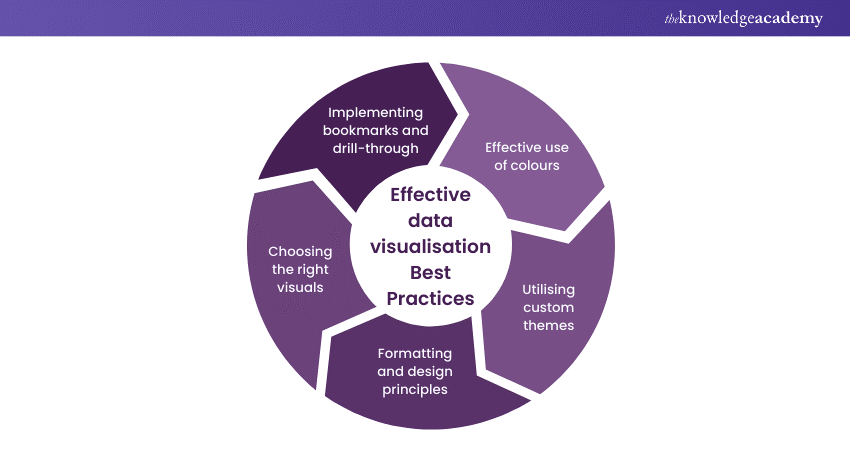
1) Choose the Right Visuals
Choosing the right visuals is fundamental to conveying your data's story effectively. Power BI offers a diverse array of visuals, such as bar charts, line charts, pie charts, maps, tables, and more. The choice of visuals depends on the nature of your data and the message you wish to communicate. For instance, a bar chart is suitable for comparing data across categories, while a scatter plot might be better for showing relationships between variables. Selecting the appropriate visual ensures that your audience can quickly grasp the insights you intend to convey.
2) Formatting and Design Principles
Effective data visualisation goes beyond selecting the right visual; it involves adhering to formatting and design principles. Pay attention to aspects like alignment, consistency, and balance in your reports. Consistent use of fonts, colours, and sizing ensures a harmonious design. It's essential to establish a clear visual hierarchy, guiding viewers through the report logically. Applying the principles of proximity, similarity, and closure can help group related elements and separate unrelated ones.
3) Utilising Custom Themes
Custom themes in Power BI allow you to personalise the appearance of your reports. With themes, you can ensure your reports align with your organisation's branding and design guidelines. By defining custom colour palettes, fonts, and styles, you can create a consistent and professional look for your reports. Moreover, custom themes can make your reports more engaging and aesthetically pleasing, which enhances the viewer's experience and makes the data more accessible.
4) Effective Use of Colours
Colours are a vital component of data visualisation. They can draw attention, convey meaning, and highlight critical information. However, the improper use of colours can lead to confusion and misinterpretation. When using colours in your Power BI reports, ensure that they serve a specific purpose. Use them to differentiate categories or highlight trends. Consider colour blindness and opt for distinct colours that are easily distinguishable by all viewers. In cases where colour is used to convey meaning, provide a clear legend or data labels to ensure comprehension.
5) Implementing Bookmarks and Drill-through
Bookmarks and drill-through functionality are potent features in Power BI that enhance user interactivity and facilitate a deeper exploration of data. Bookmarks allow you to capture a snapshot of a report's state, including visuals, filters, and slicers. Users can then navigate through the report using these predefined bookmarks, creating a guided and interactive experience. Drill-through, on the other hand, enables users to dig deeper into specific data points by clicking on visuals. These features enhance the user's ability to derive insights from the data, fostering a more engaging and interactive reporting experience.
Elevate Your Reporting with DAX – join our DAX Training today!
Performance Optimisation
In Data Analytics and Business Intelligence, being able to quickly access, analyse, and visualise data is crucial for making timely and informed decisions. This section focuses on key aspects of performance optimisation in Power BI:
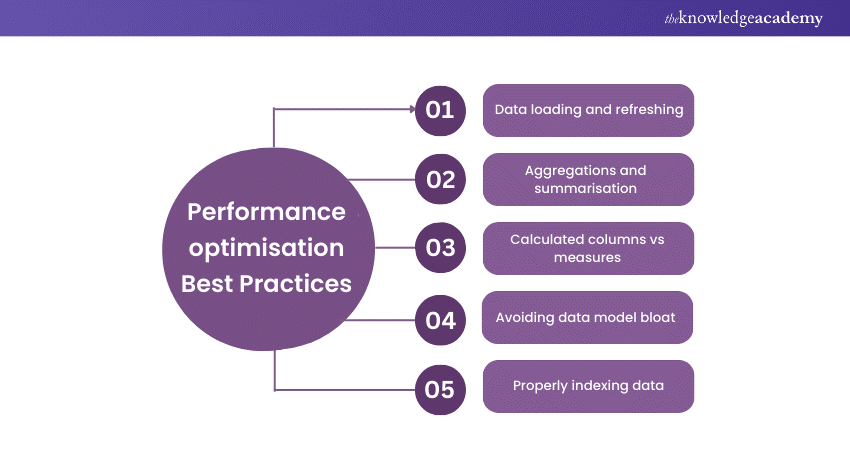
1) Data Loading and Refreshing
A seamless experience within Power BI often begins with data loading and refreshing. Whether you're working with vast datasets or real-time data sources, optimising these processes is essential. Start by understanding the frequency of data updates and determining if an incremental refresh is necessary. Leveraging parameters to control data loads and reducing the number of unnecessary columns can significantly enhance performance. Additionally, consider splitting data into smaller tables and selectively refreshing only what's essential.
2) Aggregations and Summarisation
Efficient data aggregation and summarisation are at the core of Power BI's performance. Aggregations can help accelerate query response times, mainly when working with extensive datasets. By creating optimised aggregations, you can provide quick access to high-level data insights while maintaining detailed data for deeper analysis. Carefully choose the granularity of your aggregated data to strike the right balance between performance and information depth.
3) Calculated Columns vs Measures
One of the fundamental decisions in Power BI revolves around choosing between calculated columns and measures. Understanding when to use each is crucial for performance optimisation. Computed columns can be resource-intensive and may result in data model bloat. On the other hand, measures are dynamic and calculated on the fly, making them more efficient. As a best practice, reserve calculated columns for data that genuinely requires precomputation while using measures for real-time calculations.
4) Avoiding Data Model Bloat
Data model bloat can significantly hinder performance. It occurs when your data model becomes overcrowded with unnecessary tables, columns, or relationships. To avoid bloat, rigorously evaluate whether specific data components are vital to your analysis. Cleanse your data model by eliminating extraneous tables and columns, maintaining a clear structure, and using relationships judiciously. By streamlining your data model, you can enhance query performance and minimise resource consumption.
5) Properly Index Your Data
Indexing is the secret sauce behind rapid data retrieval. In Power BI, proper indexing involves creating relationships between tables to ensure efficient data querying. The "Star Schema" and "Snowflake Schema" approaches are standard techniques for creating well-indexed data models. These approaches optimise data relationships, reducing the time required to access and analyse data. Ensuring that you establish the right relationships, employ the proper cardinality, and manage your data effectively can significantly boost query performance.
Power BI Security
With data becoming more and more valuable, safeguarding it has become of foremost importance. Microsoft's Power BI empowers organisations to transform raw data into actionable insights.
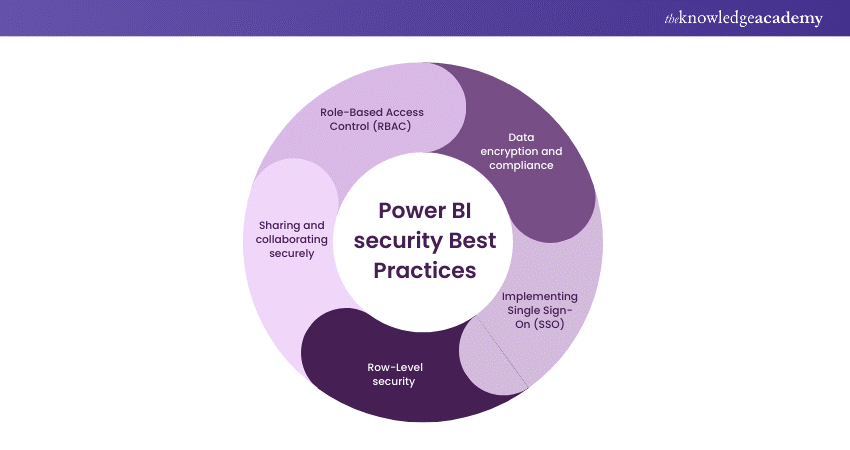
With data becoming more and more valuable, safeguarding it has become of foremost importance. Microsoft's Power BI empowers organisations to transform raw data into actionable insights. However, with the great power of data analysis comes the responsibility of ensuring its security and integrity. In this section, we delve into the essential aspects of Power BI security, covering sharing and collaboration, row-level security, Single Sign-On (SSO) implementation, data encryption and compliance, and Role-Based Access Control (RBAC).
1) Sharing and Collaborating Securely
Power BI offers a collaborative platform where multiple users can collaborate on reports and dashboards. However, ensuring data security during collaboration is of utmost importance. Power BI provides options to securely share reports and dashboards with internal and external users. It allows sharing through secure methods like sharing links, embedding codes, and securing collaboration using workspaces. Additionally, you can control permissions, define access levels, and manage users effectively.
2) Row-level Security
Row-level Security (RLS) is a crucial aspect of Power BI security, especially when sharing sensitive data. It allows you to restrict data access to the row level based on user roles. By defining roles and rules, you can ensure that users only see the data relevant to their role or department. For instance, a sales manager can access sales data for their region, while a finance manager can view financial data. RLS guarantees that data segregation is maintained and sensitive information remains protected.
3) Implementing Single Sign-On (SSO)
To enhance user experience and security, implementing Single Sign-On (SSO) is a recommended PowerBI Best Practice. SSO allows users to log in with their organisational credentials, ensuring a seamless and secure login process. By integrating with Azure Active Directory (Azure AD) or other identity providers, Power BI ensures that user access is authenticated, authorised, and logged, enhancing data security.
4) Data Encryption and Compliance
Data encryption is a fundamental aspect of Power BI security. During data transmission, Power BI uses industry-standard SSL/TLS encryption protocols to protect data in transit. Additionally, data at rest is safeguarded using advanced encryption mechanisms. Furthermore, Power BI adheres to various industry standards and compliance regulations, including GDPR, HIPAA, and ISO certifications. This ensures that your data complies with legal and industry-specific requirements.
5) Role-Based Access Control (RBAC)
Power BI provides Role-Based Access Control (RBAC) for managing access at different levels. Administrators can assign roles to users, and these roles come with specific permissions. For example, you can designate an admin role, a member role, or a contributor role. This granularity ensures that data access is tightly controlled and permissions are well-defined, enhancing overall security.
Unlock the potential of data with our Microsoft Power BI Data Analyst PL300 Course and supercharge your analytics skills!
Deployment and maintenance
Deploying and maintaining Power BI solutions efficiently is paramount for businesses to derive continuous value from their data.
Deploying and maintaining Power BI solutions efficiently is paramount for businesses to derive continuous value from their data. A well-planned deployment strategy, coupled with vigilant maintenance, ensures that Power BI reports and dashboards remain accurate and secure, and perform optimally. In this segment, we explore the essential best practices for deploying and maintaining Power BI.
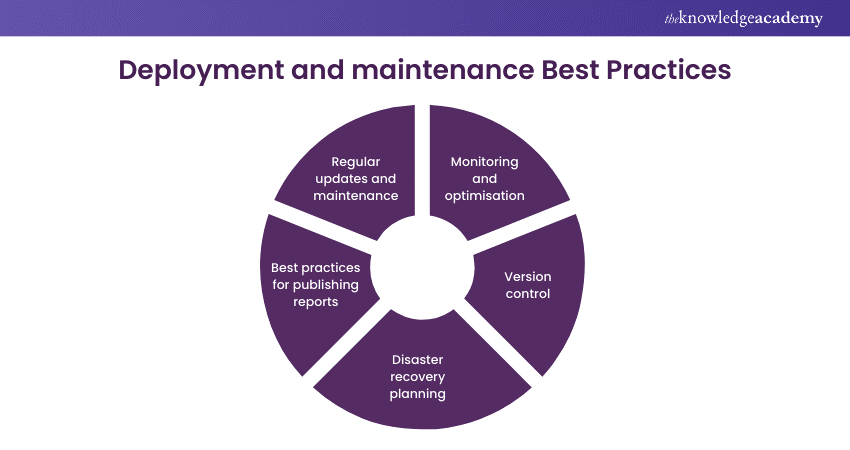
1) Best Practices for Publishing Reports
The process of deploying Power BI reports to the Power BI Service should be handled with care. After creating and testing reports in Power BI Desktop, choose a convenient time to publish. When publishing, ensure that data sources are correctly configured, and dataset refresh schedules are optimised. Additionally, establish a logical organisation of workspaces and dashboards within the Power BI Service to make reports easily accessible to your intended audience.
2) Regular Updates and Maintenance
Keeping Power BI solutions up-to-date is crucial. Regularly review your data sources, measures, and visuals to accommodate changes in your organisation's data landscape. This includes modifying queries to handle new data fields, updating visuals to reflect current business needs, and addressing any performance bottlenecks. Staying vigilant about updates helps ensure that your reports remain accurate and relevant.
3) Monitoring and Optimisation
Efficient monitoring practices help identify issues early, thereby preventing potential problems. Monitor dataset refreshes, report load times, and system resource consumption within the Power BI Service. Additionally, utilise Power BI's performance analyser to pinpoint slow-performing visuals and optimise them. This proactive approach enables you to maintain optimal report performance and user satisfaction.
4) Disaster Recovery Planning
Unforeseen incidents can disrupt your Power BI environment. Establish a disaster recovery plan to safeguard your reports and data. Regularly back up Power BI reports, datasets, and data sources to prevent data loss in the event of a failure. Create clear recovery procedures for scenarios such as accidental data corruption or data centre outages. By having a robust disaster recovery plan in place, you can minimise downtime and data loss.
5) Version Control
Version control is instrumental in managing report development and maintenance. Utilise version control systems (VCS) such as Git to track changes in your Power BI projects. VCS helps you maintain a history of report revisions, facilitate collaborative development, and recover from unintended changes. It's a valuable tool for ensuring the stability and reliability of your Power BI solutions.
Unlock the power of data with our Microsoft BI Training and gain valuable insights for informed decision-making.
Collaboration and Documentation
As organisations harness the capabilities of Power BI to analyse and visualise data, effective collaboration and documentation are essential for ensuring that insights are not siloed and that stakeholders are on the same page. In this segment, we'll explore best practices in Power BI for fostering collaboration and robust documentation.
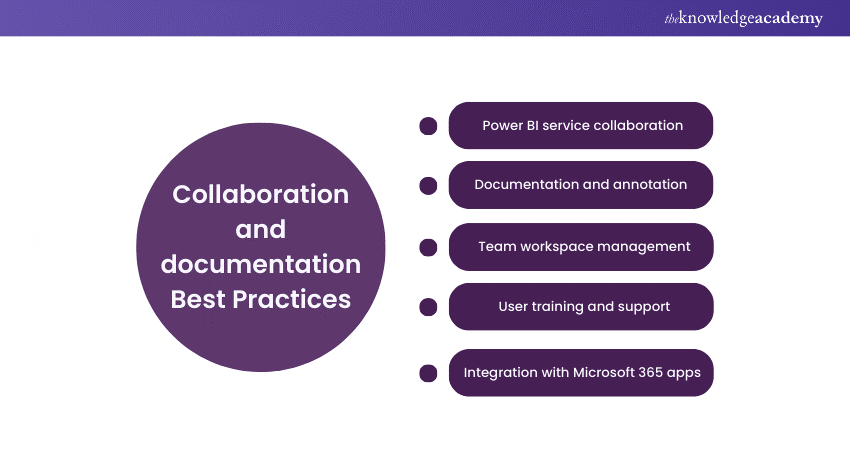
1) Power BI Service Collaboration
Power BI Service offers various sharing options, including sharing dashboards and reports with colleagues or external users. Ensure that sharing is done securely by setting up appropriate permissions, such as granting read-only access for specific users. Leverage the power of Azure AD-based access and Single Sign-On (SSO) for seamless and secure collaboration. Additionally, content packs are a fantastic way to package your dashboards, reports, and datasets for distribution across your organisation. These packs enable teams to access predefined datasets and reports, streamlining collaboration and promoting consistency in data analysis.
2) Documentation and Annotation
Accurate documentation through metadata management helps users understand the data source, data lineage, and calculations used in reports. Properly label tables, columns, and relationships to make it easy for users to comprehend the data structure. Another great practice is to utilise the commenting feature in Power BI to add context and explanations to specific visuals, reports, or datasets. Comments can help users understand the significance of data points and visualisations.
3) Team Workspace Management
In Power BI, workspaces serve as collaborative hubs where teams work on reports and dashboards. Create well-structured workspaces, assign clear roles, and provide descriptions to ensure that team members understand their responsibilities and project objectives. You can also establish version control practices to keep track of changes to reports and datasets. This is particularly useful when multiple team members are collaborating on a project. Power BI's integration with source control tools can aid in managing version history efficiently.
4) User Training and Support
Arrange training sessions for team members, especially new users, to familiarise them with Power BI's capabilities. Comprehensive training ensures that everyone can use the tool effectively and contribute to collaborative efforts. Maintaining open channels for users to seek assistance, whether through documentation, forums, or direct support is also handy. A knowledgeable support team can resolve queries promptly and help users make the most of Power BI.
5) Integration With Microsoft 365 Apps
If your organisation uses Microsoft Teams, take advantage of the integration with Power BI. This allows users to easily access reports and dashboards within the Teams environment, facilitating quick collaboration and discussions. SharePoint is an excellent platform for storing and sharing documentation. Integrate Power BI reports with SharePoint sites for easy access and reference.
Transform data into stunning visuals with our Tableau Desktop Training- join today!
Conclusion
In the realm of business intelligence, Power BI stands as an invaluable asset. However, like any tool, its potential can only be realised when wielded correctly. By following the PowerBI Best Practices outlined in this blog, you can transform your data into actionable insights that drive your business's success. From data modelling to visualisation, performance optimisation, and security, mastering these practices will empower you to become a proficient Power BI user.
Visualise processes with expert precision- get started with our FlowChart and Process Mapping Training today!
Frequently Asked Questions
What Is the Better Approach in Power BI?

The better approach in Power BI is to focus on clarity and User Experience. Design intuitive dashboards that tell a story, prioritise relevant data, and utilise consistent formatting. Always ensure data accuracy and security while encouraging feedback for continuous improvement. This will enhance decision-making and drive insights effectively.
How Do You Get the Top 5 Results in Power BI?
To get the top 5 results in Power BI, use the DAX function TOPN. Create a new measure or table and apply TOPN (5, TableName, OrderByColumn) to filter your data. You can then visualise these results using tables or charts. This method efficiently highlights key insights from your dataset.
What are the Other Resources and Offers Provided by The Knowledge Academy?
The Knowledge Academy takes global learning to new heights, offering over 30,000 online courses across 490+ locations in 220 countries. This expansive reach ensures accessibility and convenience for learners worldwide.
Alongside our diverse Online Course Catalogue, encompassing 19 major categories, we go the extra mile by providing a plethora of free educational Online Resources like News updates, Blogs, videos, webinars, and interview questions. Tailoring learning experiences further, professionals can maximise value with customisable Course Bundles of TKA.
What is The Knowledge Pass, and How Does it Work?
The Knowledge Academy’s Knowledge Pass, a prepaid voucher, adds another layer of flexibility, allowing course bookings over a 12-month period. Join us on a journey where education knows no bounds.
What are the Related Courses and Blogs Provided by The Knowledge Academy?
The Knowledge Academy offers various Business Intelligence Reporting Courses, including the Microsoft Power BI Course, Business Intelligence Analyst Course, and DAX Training. These courses cater to different skill levels, providing comprehensive insights into 15 Types of Flowcharts.
Our Office Applications Blogs cover a range of topics related to Power BI, offering valuable resources, best practices, and industry insights. Whether you are a beginner or looking to advance your knowldege of Power BI tools, The Knowledge Academy's diverse courses and informative blogs have got you covered.
Upcoming Office Applications Resources Batches & Dates
Date
 Microsoft Power BI Course
Microsoft Power BI Course
Fri 10th Jan 2025
Microsoft Power BI Course
Fri 28th Feb 2025
Microsoft Power BI Course
Fri 4th Apr 2025
Microsoft Power BI Course
Fri 16th May 2025
Microsoft Power BI Course
Fri 11th Jul 2025
Microsoft Power BI Course
Fri 19th Sep 2025
Microsoft Power BI Course
Fri 21st Nov 2025
 If you wish to make any changes to your course, please


