


 Top Rated Course

We may not have the course you’re looking for. If you enquire or give us a call on +44 1344 203 999 and speak to our training experts, we may still be able to help with your training requirements.
What is a Gantt Chart? With Benefits & Example
Eliza Taylor 09 December 2024Curious about What is a Gantt Chart? It’s a visual Project Management tool that displays tasks, timelines, and dependencies in a horizontal bar chart format. Widely used for tracking project progress, Gantt Charts help teams manage schedules efficiently. In this blog, we’ll explore its components, uses, and benefits.

Training Outcomes Within Your Budget!
We ensure quality, budget-alignment, and timely delivery by our expert instructors.
Table of Contents
Picture this - you’re managing a complex project with multiple tasks, deadlines, and team members. How do you keep everything organised and ensure timely completion? This is where Gantt Charts come into play. But What is a Gantt Chart, and how can it revolutionise your Project Management approach? It is a powerful visual tool that helps Project Managers plan, schedule, and track tasks over time. By providing a clear graphical representation of the project timeline, it allows you to see the start and end dates of tasks, their dependencies, and progress at a glance.
In this blog, we’ll explore the benefits of using Gantt Charts and provide an example to illustrate their effectiveness in real-world scenarios.
Table of Content
1) Gantt Chart - an overview
2) What are Gantt Charts used for?
3) How to use Gantt Charts?
4) What are the pros and cons of a Gantt Chart?
5) Example of Gantt Chart
6) Conclusion
Gantt Chart- an overview
As a crucial Project Management tool, Gantt Charts aid in planning and timely project completion. It presents tasks graphically over a timeline, giving Project Managers a clear view of team workloads and resource availability, facilitating precise scheduling. Gantt Charts transform project timelines into horizontal bars, showing start and end dates, task dependencies, and deadlines.
These charts also track task progress and identify responsible parties, proving indispensable for projects, portfolios, and so on. They help steer tasks towards timely completion, even with large teams and diverse stakeholders. Additionally, Gantt Charts pinpoint the critical path—the longest sequence of interlinked tasks from start to finish—key to strategic Project Execution.

What are Gantt Charts Used for?
Now that you know What is a Gantt Charts, let’s understand its use in Project Management. These charts are used to plan and schedule tasks in Project Management. It simplifies complex projects into an easy-to-follow plan and tracks the status of activities. Gantt Charts also track project deadlines, milestones, and hours worked to address delays or overages. The following are the three primary reasons why Project Managers employ Gantt Charts:
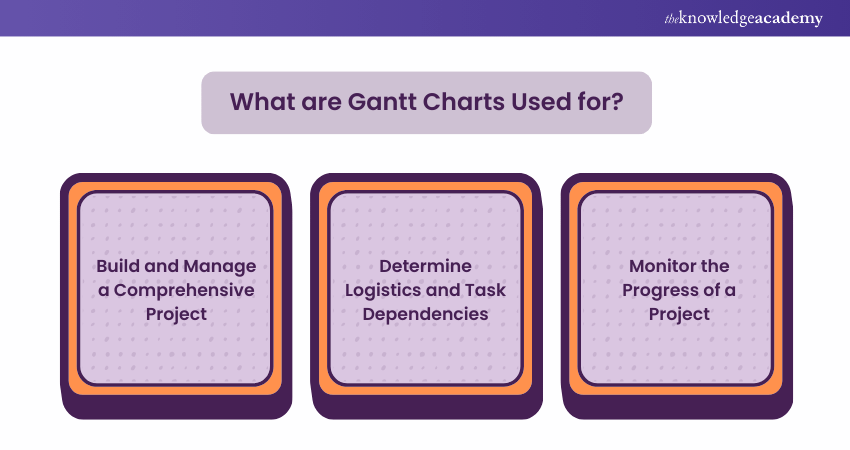
a) Build and Manage a Comprehensive Project: Gantt Charts visualise a project's building blocks and break them into smaller and more manageable assignments. The small assignments are prepared on the Gantt Chart's timeline, along with dependencies between tasks, assignees, and landmarks.
b) Determine Logistics and Task Dependencies: Gantt Charts can be operated to keep an eye on the logistics of an assignment. Task dependencies confirm that a new assignment can only start once another assignment is concluded. If an assignment is delayed, then dependent issues are automatically rescheduled. This can be particularly helpful when planning in a multi-team environment.
c) Monitor the Progress of a Project: Project Managers can scrutinise projects' progress and make necessary adjustments. A Gantt Chart can contain release dates, landmarks, or other vital metrics to track project progress.
Unlock your potential in leadership with our Project Management Certification today!
How to use Gantt Charts?
To utilise a Gantt Chart effectively in Project Management, it is essential to engage in meticulous Project Planning, consistent monitoring, and timely modifications to guarantee that the project remains aligned with the planned schedule. Here are several strategies for employing a Gantt Chart to manage your project efficiently:
1) Breakdown Structure: Start by listing all the tasks needed for the project. A Work Breakdown Structure (WBS) tool can help with this process. It ensures that tasks are completed on time.
2) Task List and Timeline: Create a list of tasks with their due dates, duration, and other details. Then, use this info to make a Gantt Chart showing task dates and durations.
3) Identify Task Dependencies: Correctly identify which tasks depend on the completion of others to maintain workflow efficiency. This step helps plan the sequence of operations and avoid bottlenecks.
4) Find the Critical Path: Identify the most extended sequence of tasks. If tasks on this path are delayed, the whole project will be delayed. Some Gantt Chart software can do this automatically.
5) Track Milestones: Monitor important events in the Project Management Timeline. Milestones show major achievements and help track overall progress.
6) Allocate and Track Resources: Estimate and assign resources effectively to ensure that you have the necessary manpower, materials, and budget to complete each task. Monitor their usage to maintain control over the project costs and schedule.
7) Create Baselines and Compare Results: Establish baselines for scope, budget, and timeline to measure project performance. Compare actual results with these baselines helps in identifying variances and taking corrective actions.
Master Project and Infrastructure strategies with our Project and Infrastructure Financing Course- register today!
What are the Pros and Cons of a Gantt Chart?
Gantt Charts are a favoured tool in Project Management, renowned for their distinctive features. While they offer numerous benefits, they are not without limitations. Let’s explore the advantages and disadvantages of Gantt Charts based on the following points.
Pros of a Gantt Chart
Here is the list of advantages of using Gantt Chart:
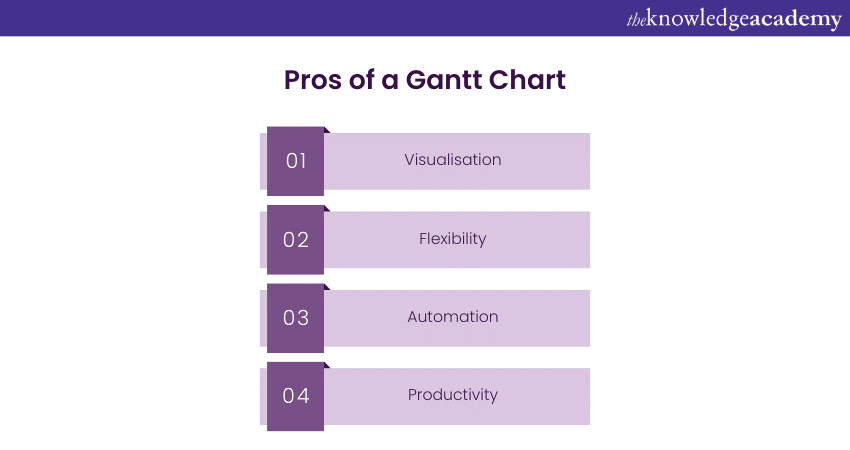
1) Visualisation: Gantt Chart makes complex tasks more understandable. It helps a Project Manager track the start and completion dates of many project subtasks simultaneously.
2) Flexibility: Gantt Chart enables managers to set the chart based on the assignment’s requirements. It can add any changes that may arise during the project.
3) Automation: Gantt Chart can be automatically updated to show the changes in the project timeline. Managers can save time and effort by not needing to add manually.
4) Productivity: Gantt Chart allows teams to stay on track with their objectives. The teams can identify what needs to be done within the timeline, increasing productivity.
Cons of a Gantt Chart
Here is the list of disadvantages of using Gantt Chart:
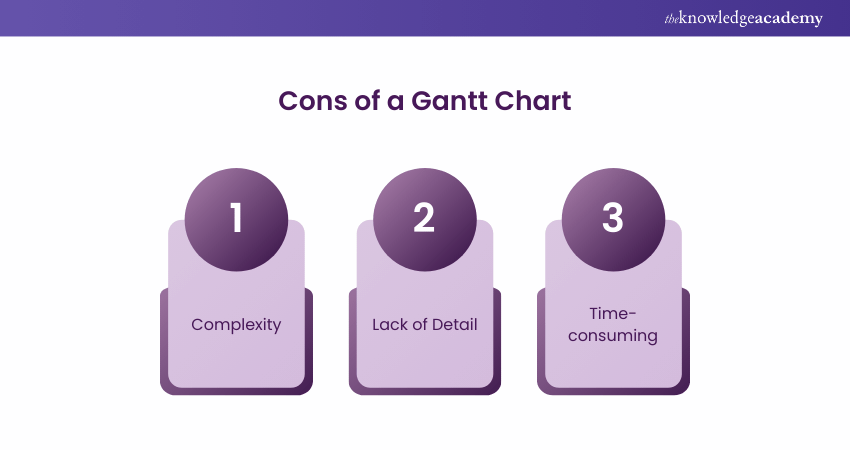
1) Complexity: While it represents complex projects, it can be challenging to read and understand. The chart shows several tasks and activities at the same time. When there are larger assignments, it may become too cluttered and hard to follow.
2) Lack of Detail: Gantt Chart offers an overview of an assignment but not detailed information about tasks and activities. Projects that need more thorough tracking may require additional charts.
3) Time-consuming: Creating a Gantt Chart manually can be long and tedious. For elaborate projects, this can introduce delays as the detailed entry of data into the chart is a slow-moving endeavour.
Example of Gantt Chart
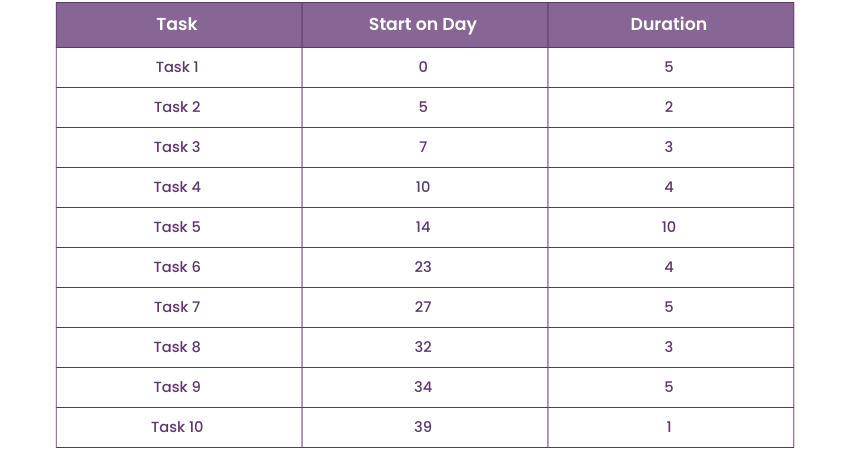
In a Gantt Chart, project tasks are displayed along the Y-axis, while their durations are shown on the X-axis. Each task is depicted by a bar, with the bar’s length indicating the task’s duration. If two bars overlap on the X-axis, it signifies that the tasks occur simultaneously. The tasks and their durations are as follows:
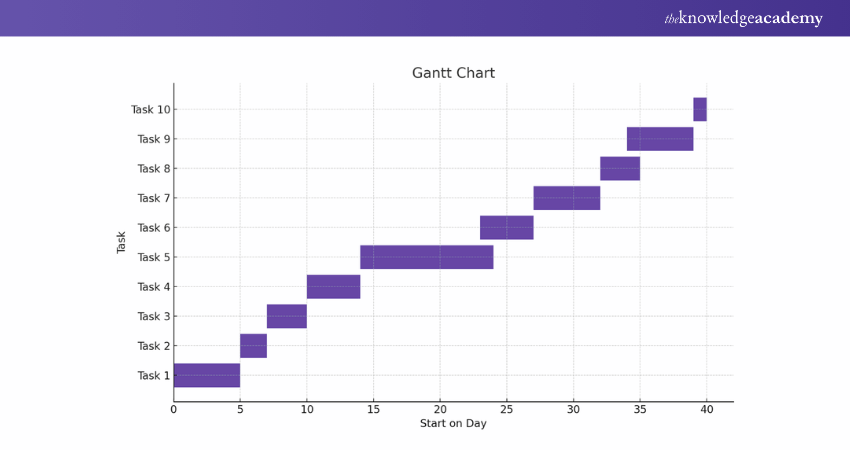
As demonstrated in this example, a Gantt Chart allows Project Managers to swiftly view essential project details, such as:
a) The list of tasks comprising the project
b) Start and end dates for each task
c) Dependencies between tasks
d) Scheduling
e) Progress of each task
f) Task owners
A Gantt Chart is particularly useful for keeping a project on track, especially when there are multiple dependencies and numerous tasks occurring simultaneously.
Conclusion
In conclusion, Gantt Charts are Project Management tools that go beyond simple timelines. By understanding What is a Gantt Chart, you can keep your projects on track and teams aligned. So, elevate your project planning and execution to new heights, and ensure that every project is a success!
Join our Project Risk Management Course and learn the strategies to keep your projects on track and within budget.
Frequently Asked Questions
What are Some Things to Look for in Gantt Chart Software?

When selecting Gantt chart software, look for features like intuitive drag-and-drop functionality, real-time collaboration, customisable templates, and integration with other Project Management tools. Ensure it offers robust reporting capabilities and supports dependencies to effectively track project progress and timelines.
How do I Remove Resources from a Gantt Chart Project?
To remove resources, go to the View tab, then select Gantt Chart. Find the task in the Task Name column, right-click it, and choose Assign Resources. In the Resource Name column, select the resource you want to remove. Then, click Remove.
What are the Other Resources and Offers Provided by The Knowledge Academy?
The Knowledge Academy takes global learning to new heights, offering over 30,000 online courses across 490+ locations in 220 countries. This expansive reach ensures accessibility and convenience for learners worldwide.
Alongside our diverse Online Course Catalogue, encompassing 19 major categories, we go the extra mile by providing a plethora of free educational Online Resources like News updates, Blogs, videos, webinars, and interview questions. Tailoring learning experiences further, professionals can maximise value with customisable Course Bundles of TKA.
What is the Knowledge Pass, and How Does it Work?
The Knowledge Academy’s Knowledge Pass, a prepaid voucher, adds another layer of flexibility, allowing course bookings over a 12-month period. Join us on a journey where education knows no bounds.
What are Related Courses and Blogs Provided by The Knowledge Academy?
The Knowledge Academy offers various Project Management Courses, including Project Management Office Fundamentals Certification Course, PgM (Programme Management) Course and CGPM (Certified Global Project Manager) Course. These courses cater to different skill levels, providing comprehensive insights into Agile Project Management With Scrum.
Our Project Management Blogs cover a range of topics related to Project Management Tools, offering valuable resources, best practices, and industry insights. Whether you are a beginner or looking to advance your Project Management skills, The Knowledge Academy's diverse courses and informative blogs have you covered.
Upcoming Project Management Resources Batches & Dates
Date
 Waterfall Project Management Certification Course
Waterfall Project Management Certification Course
Fri 14th Feb 2025
Waterfall Project Management Certification Course
Fri 9th May 2025
Waterfall Project Management Certification Course
Fri 12th Sep 2025
Waterfall Project Management Certification Course
Fri 19th Dec 2025
 If you wish to make any changes to your course, please


