We may not have the course you’re looking for. If you enquire or give us a call on +31 208081674 and speak to our training experts, we may still be able to help with your training requirements.
We ensure quality, budget-alignment, and timely delivery by our expert instructors.

Six Sigma Tools provides businesses with a systematic approach to enhance processes, reduce defects, and drive efficiency. However, Six Sigma's foundation lies in its tools, enabling companies to analyse data effectively, identify problems, and implement targeted improvements.
Six Sigma has gained widespread popularity across industries as a powerful approach for achieving operational excellence and driving business success. Read this blog to learn about and understand the top 10 Six Sigma Tools such as DMAIC, Pareto Chart, Regression, and more.
Table of Contents
1) List of Six Sigma Tools and techniques
2) What is the Importance of Six Sigma Tools?
3) Advantages of Six Sigma Tools
4) Conclusion
List of Six Sigma Tools and Techniques
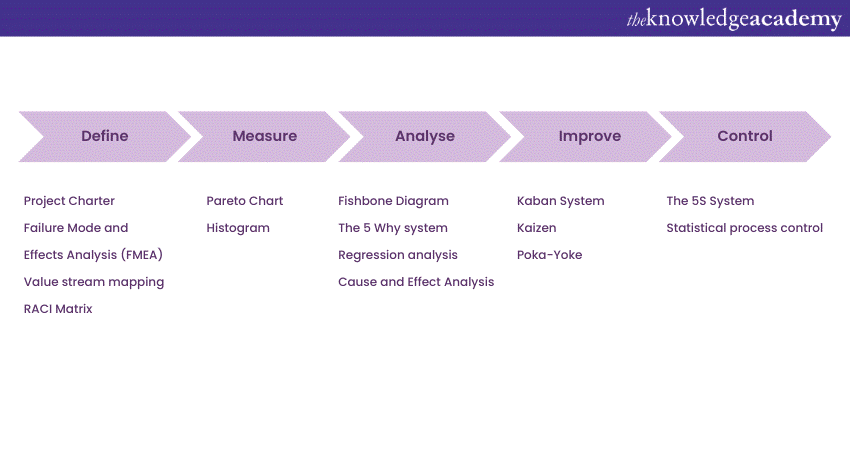
Six Sigma tools are essential components of the Six Sigma methodology. They help businesses analyse data effectively, identify problems, and drive process improvements. These tools provide the means to measure, monitor, and optimise processes, enhancing quality and operational efficiency. The following are the top 10 Six Sigma tools that can help businesses succeed.

1) DMAIC
Define, Measure, Analyse, Improve, and Control (DMAIC) is a problem-solving methodology that provides a structured framework for tackling process-related issues and driving continuous improvement. The following are the steps of this Six Sigma tool:
a) Define: Here, the problem or opportunity for improvement is defined.
b) Measure: Data is collected to quantify the current state of the process and establish a baseline for comparison.
c) Analyse: The collected data is analysed to identify patterns, root causes, and areas of improvement.
d) Improve: The focus is on developing and implementing solutions for the identified root causes.
e) Control: Establishes the control mechanisms and monitors systems to sustain the improvements achieved.
2) Pareto chart
The Pareto chart is a valuable tool in the Six Sigma methodology. It identifies and prioritises problems or issues based on their significance. The chart is named after Vilfredo Pareto, an Italian economist who observed that a significant majority of wealth was owned by a minority of the population, leading to the concept of the "vital few" versus the "trivial many."
This Six Sigma Case Study tool is a bar graph displaying the data in descending order of frequency or impact. It helps businesses focus their improvement efforts on the most critical factors contributing to many problems or defects. By addressing these vital factors, organisations can substantially improve process performance.
The construction of a Pareto chart comprises many steps that allow users to represent the factors that contribute to the problems visually. Here is a step-by-step procedure to construct your own Pareto chart effectively:
a) Define the problem: Clearly define the problem or issue you want to address using the Pareto chart. For example, it could be customer complaints, types of defects, or causes of delays.
b) Collect data: Gather relevant data related to the problem. This data could be in the form of counts, frequencies, or impact levels. Ensure you have sufficient data to analyse and categorise.
c) Categorise the data: Categorise the data into different factors or categories contributing to the problem. For example, if the problem is customer complaints, categories could be product quality, delivery issues, or customer service.
d) Determine the measurement unit: Identify the measurement unit for the data, such as the number of occurrences, percentage, or impact score. This will be used to quantify the factors.
e) Calculate frequencies or impact: Calculate each category's frequencies or impact level based on the data collected. This step helps determine the magnitude of each factor's contribution.
f) Order the categories: Arrange them in descending order based on their frequencies or impact levels. The category with the highest frequency or impact should be on the left, followed by the next highest, and so on.
g) Create the chart: On a graph, plot the frequencies or impact levels on the left vertical axis. Use a bar for each category, with the height of each bar representing its corresponding frequency or impact level.
h) Add the cumulative percentage line: Plot a line graph on the right vertical axis to represent the cumulative percentage. This line shows the cumulative contribution of each category as you move from left to right.
i) Analyse and interpret: Analyse the Pareto chart to identify the vital few categories contributing to most of the problem. Focus your improvement efforts on addressing these significant factors.
Unlock your potential and take your career to new heights with Six Sigma Green Belt course. Learn the skills and knowledge to improve processes, reduce defects, and drive efficiency.
3) Histogram
A histogram is a fundamental tool in the Six Sigma methodology that helps businesses gain insights into data distribution and make informed decisions. This Six Sigma tool gives a visual representation of the frequency or distribution of a data set, allowing practitioners to analyse patterns and variations effectively.
Furthermore, by using this Six Sigma tool, businesses can identify essential characteristics of their processes, such as central tendency, spread, and shape of data. These details are vital for understanding the performance of the process and identifying areas for improvement.
More importantly, Histograms are particularly useful in identifying outliers, assessing data quality, and understanding the root causes of variation within a process. They provide a visual representation that helps practitioners and decision-makers quickly understand data distribution.
Now a user can interpret a histogram by analysing its shape, centre, and spread. The common histogram shapes include bell-shaped (normal distribution), skewed (asymmetric distribution), and bimodal (two distinct peaks). A comprehensive understanding of these characteristics can provide valuable insights into process performance and guide improvement efforts.
Here are the four steps to construct a basic histogram:
a) Gather data: Collect the data you want to analyse and represent in the histogram. Ensure that the data is relevant and accurately recorded.
b) Determine the number of bins: Decide on the number of bins or intervals used to group the data. The number of bins should be sufficient to capture the range of values and provide meaningful insights.
c) Calculate frequencies: Count the number of data points within each bin. Determine the frequency or count for each bin by tallying the occurrences of data points within the specified range.
d) Plot the histogram: On a graph or chart, plot the frequencies on the vertical axis and the bins on the horizontal axis. Each bin should be represented as a bar, with the height of the bar corresponding to the frequency or count of data points in that bin.
Learn the fundamentals of Six Sigma methodology with our Six Sigma Yellow Belt course.
4) Kanban system
The Kanban system is a lean management tool that optimises workflow efficiency, reduces waste, and enhances business productivity. Originating from the Toyota Production System, Kanban has gained widespread popularity across industries due to its simplicity and effectiveness in managing and visualising work processes.
At its core, this Six Sigma tool uses visual cues, typically represented by cards or sticky notes, to signal the status and progression of tasks or items within a workflow. The system ensures that work is started when there is capacity to perform the task. This prevents overburdening and maintains a steady flow of tasks.
The key principles of this Six Sigma tool include visualising work, limiting Work in Progress (WIP), and optimising the flow of tasks. Teams can gain a clear and real-time understanding of the status of each task, enabling effective coordination and collaboration. These enhancements in their workflow are leveraged by visualising the work on a Kanban board.
The Kanban system is a powerful tool for streamlining workflows, promoting efficiency, and driving continuous organisational improvement. It can be applied across manufacturing, software development, project management, or service-oriented environments.
5) Kaizen
It is a Japanese term meaning "change for the better". Kaizen is a philosophy and approach that promotes continual improvement in all aspects of an organisation. Rooted in the Toyota Production System, it focuses on incremental and continuous changes that lead to significant improvements over time. It fosters a constant learning, collaboration, and innovation culture, making it a cornerstone of lean management and Six Sigma methodologies.
Additionally, the fundamental principle of this Six Sigma tool is the belief that every process, no matter how efficient, can be further improved. It encourages employees at all levels to actively contribute ideas, seek better ways of doing things, and challenge the status quo. Kaizen taps into the collective intelligence and creativity of the workforce by promoting employee engagement and empowerment.
Furthermore, implementing this Six Sigma tool can bring numerous benefits to organisations, including increased productivity, enhanced quality, reduced waste, improved employee morale, and customer satisfaction. It promotes continuous learning and improvement, helping businesses remain agile and adapt to changing market demands.
Become a master of process improvement and drive organisational excellence with Six Sigma Black Belt course. Join now!
6) Failure Mode and Effects Analysis (FMEA)
FMEA is a proactive and systematic approach businesses use to identify and address potential failures and risks in processes, products, or systems. This Six Sigma tool is essential within the Six Sigma methodology that aims to enhance reliability, prevent defects, and improve overall quality.
More importantly, this Six Sigma tool encourages cross-functional team collaboration to identify failures, determine their causes, and evaluate their potential effects on performance, safety, or customer satisfaction.
The FMEA process typically involves three key steps:
1) Identification
2) Analysis
3) Risk mitigation
Firstly, the team identifies potential failure modes and their causes, considering all possible scenarios and variables. Then, they analyse its severity, the likelihood of occurrence, and the detectability of each failure mode to assign a Risk Priority Number (RPN). Once the failure modes have been prioritised based on the RPN, the team focuses on developing and implementing risk mitigation strategies.
7) Value stream mapping
Value Stream Mapping (VSM) is a powerful lean management tool that enables businesses to analyse and optimise the flow of materials, information, and activities across a process or value stream. It visually represents a process's current and desired future state, facilitating a deep understanding of process flow and identifying areas for improvement.
Furthermore, the main objective of this Six Sigma tool is to eliminate waste, reduce lead times, and improve overall efficiency. It involves mapping the entire value stream, from supplier to customer, and identifying value-added and non-value-added activities. By distinguishing between these activities, organisations can focus their efforts on enhancing value while minimising or eliminating wasteful steps.
VSM is a continuous improvement tool that allows organisations to achieve greater operational efficiency, reduced lead times, improved quality, and increased customer satisfaction. Businesses can streamline their processes by identifying and eliminating waste in the value stream. They can thus optimise resource utilisation and deliver greater value to their customers.
Accelerate your Six Sigma journey and upgrade your skills with our Six Sigma Black Belt Upgrade Course.
8) The 5S system
The 5S system is a workplace organisation method that aims to create a clean, organised, and efficient environment. The 5S system, originating from Japanese manufacturing techniques, focuses on five key principles:
a) Sort: This principle involves separating unnecessary items from necessary ones. It promotes decluttering and removing items that are not essential to the work process.
b) Set order: This principle focuses on arranging items and equipment logically and ergonomically. Everything should have a designated place, making it easier for employees to find and access tools or materials when needed.
c) Shine: This principle emphasises the importance of cleanliness and maintenance. It involves regular workspace cleaning and inspection to ensure a safe and healthy environment.
d) Standardise: This principle aims to establish consistent practices and procedures. It involves developing standardised work instructions, visual aids, and checklists to ensure everyone follows the same processes.
e) Sustain: This principle focuses on maintaining the improvements achieved through the previous steps. It involves creating a culture of discipline and ownership, where employees take responsibility for sustaining the 5S practices.
9) The 5 Why system
The 5 Why system is a simple yet powerful technique that tackles the root causes of problems or issues within a process or system. It involves repeatedly asking "Why?", to uncover the underlying factors contributing to a particular problem.
Using this Six Sigma tool begins with identifying a problem and asking why it occurred. The answer to the first "Why?" question is then used as the basis for the second "Why?" question, and so on until the team reaches a point where the true root cause is identified.
Furthermore, businesses can identify and address the underlying causes of problems rather than merely treating symptoms. This approach leads to more effective problem resolution, improved processes, and reduced recurrence of issues.
Take your mastery of Six Sigma to the pinnacle with our Six Sigma Master Black Belt course.
10) Regression analysis
It is a statistical technique that explores the relationship between dependent and independent variable(s). It allows businesses to understand how changes in the independent variables influence the dependent variable and make predictions based on this understanding.
The primary aim of this Six Sigma tool is to identify and quantify the strength and direction of the relationship between variables. It helps answer questions such as "How does advertising expenditure impact sales?" or "What factors influence customer satisfaction?" Regression analysis provides insights into the underlying patterns and associations between variables by analysing historical data.
11) Fishbone diagram
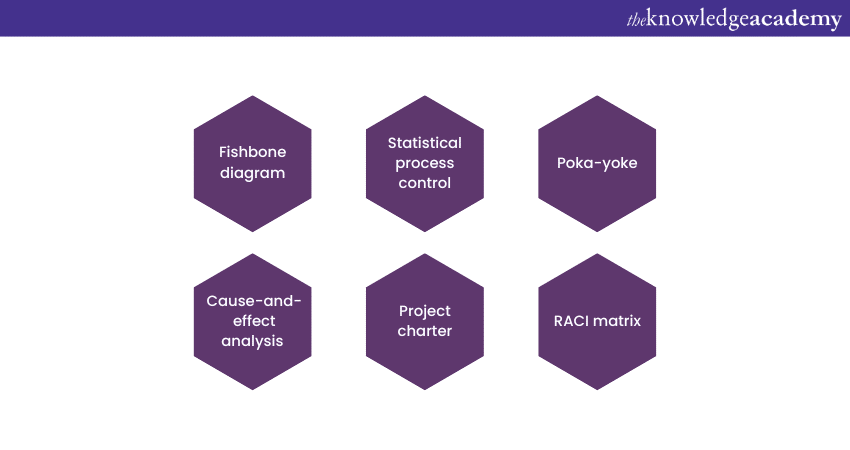
What is Fishbone Diagram, also termed as Ishikawa diagram this tool seeks to know all the contributing root causes that are or may be leading to a defect in a process. Since the issue is represented like a fish spine and all contributing root causes as branches emanating from that spine, it ends up looking like a fishbone, hence the name.
12) Statistical process control
Once you have improved in a process, you need to make sure that you hold on to it. Sustaining the development and meeting end requirements at the same time is what this Lean Six Sigma certification helps us with. SPC ensures that the process remains stable.
13) Poka-Yoke
Also known as Mistake Proofing. You do not want a customer to point out mistakes with your products or services. The best way to deliver without any error is by preparing checklists and going through them one by one before sending them out. This way, you will spare yourself the embarrassment.
Learn to eliminate defects by signing up for Six Sigma Certification Training Courses now!
14)Cause-and-Effect Analysis
When you have a severe problem, it's essential to explore all the things that could cause it before thinking about a solution. That way, you can solve the problem entirely the first time rather than just addressing part of it and having it run on and on.
Cause and Effect Analysis gives you a helpful way of doing this. This diagram-based technique combines trial and error techniques to handle any project.
15) Project charter
A lean six sigma project charter serves as a road map for your project, outlining important facts, objectives, and many other crucial elements. Additionally, it serves as a contract between the project's implementation team and its sponsor, who provides financial support. To keep everyone on track and informed, including shareholders and team members, this project charter helps spell out expectations, including milestones and deliverables.
16) RACI Matrix
The RACI matrix serves as a document that elucidates the individuals or groups accountable for the successful culmination of a project and delineates the specific functions they will undertake throughout its duration. The acronym RACI signifies the various categories of responsibilities: Responsible, Accountable, Consulted, and Informed.
A triumphant project management endeavour hinges on a comprehensive comprehension of roles and obligations across the team. Utilising an RACI matrix to allocate and expound upon each part presents an excellent method for steering a project on course and positioning it for triumph. When crafted adeptly, the RACI matrix empowers a project manager to help ensure its success even before its inception.
Register for our course on Lean Six Signa Black Belt Upgrade today!
What is the Importance of Six Sigma Tools?
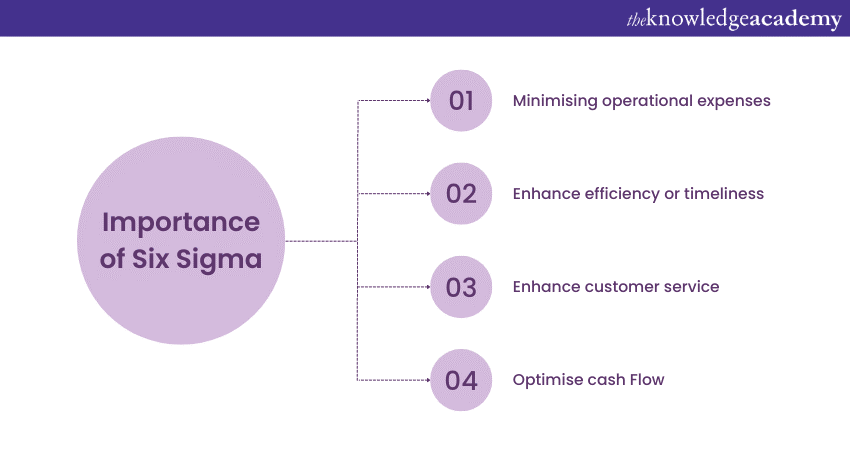
The Importance of Six Sigma Tools are as follows:

Minimising operational expenses: Managing operational costs and mitigating associated risks are pivotal considerations for numerous globally operating companies. These factors often lead to reduced profits or even financial losses. While certain risks may remain unavoidable and operational expenses remain constant, the Six Sigma methodology offers a strategic path that substantially curbs an organisation's exposure to risks. Furthermore, it enhances an organisation's efficiency and effectiveness in delivering its products or services.
Enhance efficiency or timeliness: Employing Six Sigma initiatives contributes to refining overall process efficiency. Moreover, improving project output delivery timelines or ensuring punctual delivery of products or services becomes a prime target for Six Sigma projects. In the pursuit of timeliness enhancement, Six Sigma efforts might minimise the number of machine setups or setup hours in manufacturing processes, amplify production or assembly line productivity, and automate processes partially or entirely where excessive manual intervention prevails.
Enhance customer service: A company's reputation is significantly shaped by its customer interactions. Maintaining stable customer interactions is paramount, as dissatisfied customers are often vocal critics. Leveraging Six Sigma projects aids in pinpointing the variations customers encounter, discerning their underlying causes, and devising strategies to minimise customer dissatisfaction. Such initiatives can also focus on enhancing both customer and vendor satisfaction.
Optimise cash Flow: Six Sigma initiatives can be directed at alleviating DSO (Days Sales Outstanding) within a business. Enhanced DSO translates to improved cash flow. A higher DSO reflects a reduced capacity for converting credit sales into cash. Six Sigma projects can target reducing variation within processes like Invoicing, Accounts Payable, Accounts Receivable, and Inventory Management. Identifying measurable critical defects across these processes is crucial for enhancing cash flow. Precisely narrowing down the scope of improvement remains a necessary step.
Ready to become certified? Grab the Six Sigma Green Belt Study Guide now!
Advantages of Six Sigma Tools

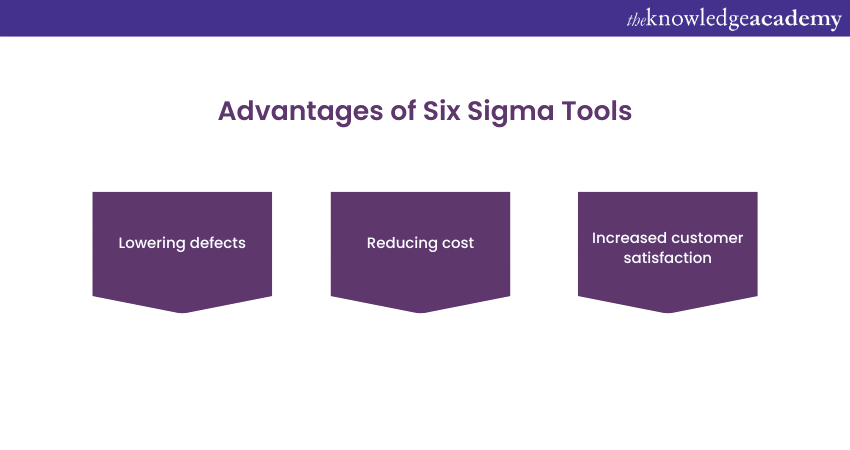
Six Sigma has a track record of adding more value and ensuring quality to the business in the form of incremental improvements to a product or a service. It also optimises supply chain processes and increases customer satisfaction. The advantages of Six Sigma go beyond simple problem-solving and consider the entire production process:
Lowering defects: Six Sigma entirely revolves around one principle, i.e. reducing defects and ultimately increasing product or service quality. So when an organisation implements Six Sigma in their process, the business will totally focus on that one principle-based statistical data-driven approach.
Reducing cost: This is one of the final and long-term benefits businesses get when implementing Six Sigma. Six Sigma implementation reduces defects, saving time, resources, power, and workforce efforts.
Increased customer satisfaction
Six Sigma implementation starts with measuring the variation, measuring the gap between the customer's needs and what he gets. A successful Six Sigma implementation helps sustain businesses in the long run; it will ultimately reduce the frequent variations in the services or products, automatically increasing customer satisfaction and customer loyalty.
Conclusion
We hope you enjoyed reading this blog on Six Sigma Tools and how you can use them to help manage business processes effectively. With such tools, you can control different aspects of the organisation's operations and ensure they are carried out efficiently and effectively. These tools help companies streamline their processes, eliminate waste, improve quality, and improve customer satisfaction. Mastering Six Sigma methodologies and tools can significantly enhance your career prospects and earning potential, potentially leading to higher Six Sigma Salaries and increased job opportunities within various industries.
Don't miss out on this chance to become a true master of Six Sigma. Register in our Six Sigma Master Black Belt Upgrade course.
Frequently Asked Questions
Upcoming Business Improvement Resources Batches & Dates
Date
 Six Sigma Green Belt
Mon 24th Feb 2025
Mon 3rd Mar 2025
Mon 10th Mar 2025
Mon 17th Mar 2025
Mon 24th Mar 2025
Mon 31st Mar 2025
Mon 7th Apr 2025
Mon 14th Apr 2025
Tue 22nd Apr 2025
Mon 28th Apr 2025
Tue 6th May 2025
Mon 12th May 2025
Mon 19th May 2025
Tue 27th May 2025
Mon 2nd Jun 2025
Mon 9th Jun 2025
Mon 16th Jun 2025
Mon 23rd Jun 2025
Mon 30th Jun 2025
Mon 7th Jul 2025
Mon 14th Jul 2025
Mon 21st Jul 2025
Mon 28th Jul 2025
Mon 4th Aug 2025
Mon 11th Aug 2025
Mon 18th Aug 2025
Tue 26th Aug 2025
Mon 1st Sep 2025
Mon 8th Sep 2025
Mon 15th Sep 2025
Mon 22nd Sep 2025
Mon 29th Sep 2025
Mon 6th Oct 2025
Mon 13th Oct 2025
Mon 20th Oct 2025
Mon 27th Oct 2025
Mon 3rd Nov 2025
Mon 10th Nov 2025
Mon 17th Nov 2025
Mon 24th Nov 2025
Mon 1st Dec 2025
Mon 8th Dec 2025
Mon 15th Dec 2025


 Top Rated Course


 If you wish to make any changes to your course, please


