We may not have the course you’re looking for. If you enquire or give us a call on +64 98874342 and speak to our training experts, we may still be able to help with your training requirements.
We ensure quality, budget-alignment, and timely delivery by our expert instructors.

Struggling to turn raw data into actionable insights? Imagine having the power to transform your data analysis with just a few clicks. Connecting Power BI to SQL Server is the solution you need. This integration allows you to leverage the strengths of both platforms, providing real-time Data Analysis and interactive visualisations.
Curious how connecting Power BI to SQL can simplify your data processes and improvise your decision-making process? This blog will study this streamlined procedure, giving you insights to unlock the full potential of your data! Let’s begin!
Table of Contents
1) Overview of SQL Server and Power BI
2) Pre-requisites to Connect Power BI to SQL
3) What are the Benefits of Connecting Power BI to SQL Server?
4) Steps to Connect Power BI to SQL
5) Getting Started With Power BI SQL
6) What are the Best Practices for Connecting Power BI to SQL Server?
7) Conclusion
Overview of SQL Server and Power BI
SQL Server, developed by Microsoft, is an effective Relational Database Management System (RDBMS). It excels at storing, managing, and manipulating data records through the usage of SQL queries. With its sturdy functions, SQL Server offers complete records storage, retrieval, safety, and evaluation capabilities.
Power BI, additionally evolved with the aid of Microsoft, is a dynamic Business Intelligence (BI) and information visualization tool. It seamlessly integrates with SQL Server, permitting customers to attach, import, and rework information from SQL Server databases. Power BI empowers users to create interactive dashboards, reports, and visualizations, allowing facts exploration, trend identity, and facts-driven decision-making. This integration with SQL Server is a key consideration when comparing SSRS vs Power BI for reporting solutions.
The combination of Structured Query Language (SQL) Server and Power BI forms a robust statistics environment that enables companies to manage and derive precious insights from their facts successfully.
Pre-requisites to Connect Power BI to SQL
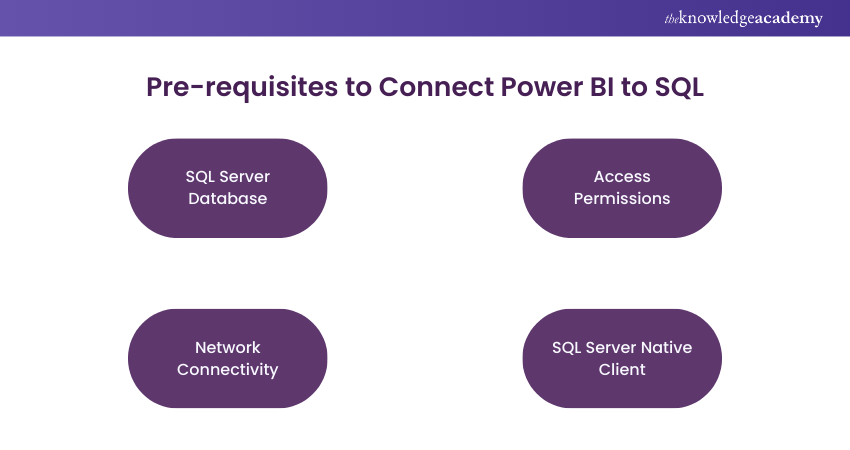
To connect Power BI to SQL, there are a few pre-requisites that need to be met:

a) SQL Server Database: A consumer should have a functioning SQL Server database in location, either on-premises or within the cloud. Ensure the SQL Server instance is accessible and handy from the community wherein Power BI is installed.
b) Access Permissions: A user needs appropriate access permissions to connect to the SQL Server database. They also need to have the necessary credentials, such as a username and password or Windows authentication credentials, with sufficient privileges to access the database and retrieve the required data.
c) Network Connectivity: Ensure a community connection between the Power BI machine and the SQL Server. This can be done through a Local Area Network (LAN) or a Virtual Private Network (VPN) if the SQL Server is placed remotely.
d) SQL Server Native Client: Install the SQL Server Native Client on the Power BI machine. This client software enables Power BI to connect to the SQL Server database and retrieve the facts. The model of the SQL Server Native Client ought to be well suited with the version of the SQL Server you're connecting to.
The fulfilment of these pre-requisites establishes a connection between Power BI and SQL Server. The connection enables data retrieval, analysis, and visualisation within the Power BI environment.
What are the Benefits of Connecting Power BI to SQL Server?
Connecting Power BI to SQL Server offers numerous benefits that enhance Data Analysis and reporting capabilities. Let’s look at them in the following points:
1) Real-time Data Analysis
Real-time data analysis is an essential feature when linking Power BI to SQL Server. To conduct real-time Data Analysis in Power BI, follow these steps:
a) Install Power BI Desktop
b) Connect to SQL Server
c) Select the Data Source and Database
d) Choose Tables and Views, Transform and Clean the Data
e) Create Visualisations
2) Interactive Dashboards
Interactive dashboards in Power BI provide users with dynamic and customisable Data Visualisations, enabling actual-time insights and analysis. To create interactive dashboards in Power BI, follow these steps:
a) Connect Power BI Desktop to SQL Server
b) Select the desired data source and database
c) Choose the relevant tables and views for your dashboard
d) Transform and clean the data as needed
e) Create visualisations using Power BI’s intuitive drag-and-drop interface
By connecting Power BI to SQL Server, customers can benefit from real-time statistics analysis for up to date insights, interactive dashboards that permit for exploration and drill-down skills as well as clean facts manipulation via filtering, sorting, and slicing. Additionally, collaborative decision-making is facilitated by way of sharing dashboards and reports with stakeholders.
3) Easy Data Manipulation
Linking Power BI to SQL Server facilitates straightforward data manipulation and analysis. Follow these steps to connect them:
a) Install Power BI Desktop
b) Connect to SQL Server
c) Select the data source and database
d) Choose the tables and views
e) Transform and clean the data
f) Create visualisations
Enhance your career with our comprehensive PostgreSQL Administration Training – secure your spot now!
4) Collaborative Decision Making
Collaborative decision-making is a significant advantage of linking Power BI to SQL Server. Here are the steps to enhance collaboration:
a) Share dashboards: Publish your Power BI reports to the Power BI service and share them with your team members.
b) Collaborate in real time: Use the Power BI service to work with others by adding comments and annotations to reports.
c) Enable data-driven discussions: Utilise the Q&A feature in Power BI to engage in interactive discussions around the data.
d) Create and share insights: Leverage Power BI’s sharing capabilities to distribute reports and insights with stakeholders.
Steps to Connect Power BI to SQL
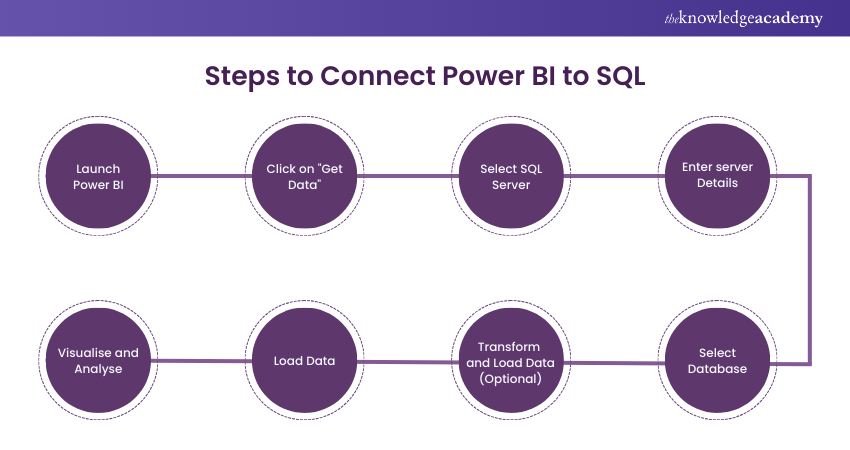
Here are the steps to establish a connection between Power BI and SQL Server:

a) Launch Power BI: To connect Power BI to SQL Server, open Power BI Desktop. Power BI Desktop is the application for designing and creating reports and visualisations.
b) Click on "Get Data": In the Power BI Desktop, navigate to the Home tab, where you will find a toolbar with various options. Click on the "Get Data" button, which allows you to choose the data source from which you want to import data into Power BI.
c) Select SQL Server: Once you click "Get Data," a window with a list of available data source options will appear. Select "SQL Server" from this list as the desired data source to establish a connection with SQL Server.
d) Enter Server Details: In the SQL Server window, you need to provide the necessary information to connect to the SQL Database. The information includes specifying the server's name or IP address. You also need to choose the appropriate authentication method, that is Windows or Database authentication. If required, enter the proper credentials to access the SQL Server.
e) Select Database: After successfully connecting to the SQL Server, you'll be supplied with a list of databases available on that server. Choose the precise database that incorporates the data you want to import into Power BI.
f) Transform and Load Data (Optional): After transforming the data (if applicable), click on the "Load" button to import the statistics from SQL Server into Power BI. Power BI will retrieve the chosen data from the SQL Server database and load it into the Power BI information model for further evaluation.
g) Load Data: After transforming the data (if applicable), click at the "Load" button to import the statistics from SQL Server into Power BI. Power BI will retrieve the chosen data from the SQL Server database and load it into the Power BI information model for further evaluation.
h) Visualise and Analyse: With the data correctly loaded into Power BI, you can start developing visualisations, reviews, and dashboards primarily based on the imported facts. Utilise the diverse visualisation alternatives to be had in Power BI to explore the facts, discover insights, and analyse the data correctly.
Master the knowledge to handle complex data challenges – join our SQL Courses now!
Getting Started With Power BI SQL
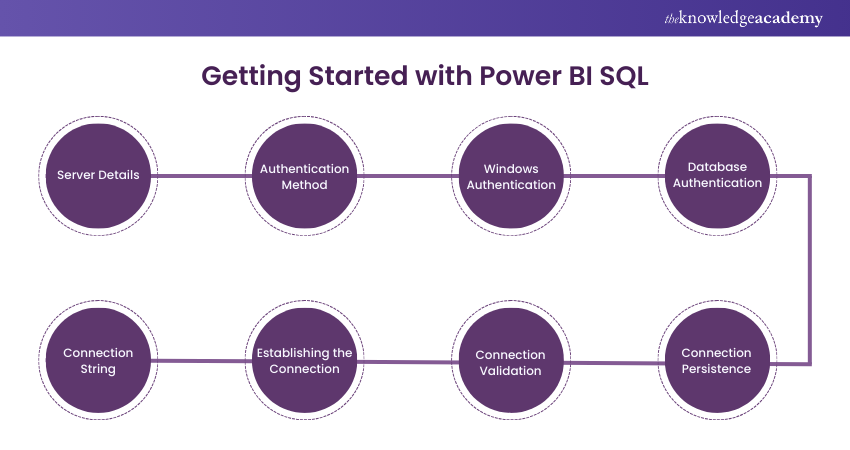
Here are the key steps to establish a connection with SQL Server from Power BI:

1) Establishing a Connection to SQL Server
To establish a connection to SQL Server, consider the following points:
a) Server Details: Provide the server's name or IP address of the SQL Server instance you want to connect.
b) Authentication Method: Choose the appropriate authentication method. Windows authentication uses the credentials of the currently logged-in user, while Database authentication requires user credentials to access the SQL Server.
c) Windows Authentication: If using Windows authentication, the client application will pass the current user's credentials to the SQL Server for authentication.
d) Database Authentication: If using Database authentication, provide the username and password associated with the SQL Server login.
e) Connection String: A connection string is a set of parameters that specify the connection details, including the server's name, authentication method, and credentials. The client application utilises the string to establish the connection to the SQL Server.
f) Establishing the Connection: Once the connection details are provided, the client application attempts to connect to the SQL Server using the specified server name, authentication method, and credentials.
g) Connection Validation: The client application verifies the validity of the connection by checking if it can successfully connect to the SQL Server using the provided information.
h) Connection Persistence: The established connection can be persisted for future use, allowing the client application to reuse the connection instead of establishing a new one each time.
2) Customising and Refining the Data
Once you've got imported data from a SQL Server database into a client software like Power BI, you can customise and refine the statistics further to fit your unique needs. This customisation includes making use of diverse data transformation operations to shape the data right into an extra meaningful and useful layout for analysis and visualisation.Power BI offers a robust feature known as Power Query Editor, enabling users to execute different data manipulation activities. Using Power Query Editor allows you to filter, sort, aggregate, and merge data tables effortlessly. Performing these tasks can assist in cleaning and formatting the data to make it suitable for analysis, eliminating errors, converting data types, and organising it to match your analytical objectives.
Furthermore, Power Query Editor allows you to create calculated columns by using defining custom formulas based totally on current columns. This allows you to derive new insights from the information by acting calculations or applying conditional logic. You can also remove duplicates from the data to ensure information integrity and enhance the accuracy of your evaluation.
In addition to data transformation, Power BI enables you to establish relationships between tables. By defining relationships based on shared columns, you can integrate data from multiple tables and unlock deeper insights by leveraging the connections between related data.
3) Creating Visualisations
Creating visualisations in Power BI is vital in Data Analysis, enabling precise and understandable presentations of complex information. Power BI offers diverse visualisation options, including bar charts, line charts, pie charts, maps, and tables. Users can customise visual elements such as colours, labels, and fonts to create visually appealing dashboards and reports. Interactivity is also a key feature, allowing users to explore data through filters, slicers, and drill-through actions. Publishing and sharing visualisations facilitate collaboration and communication of insights within teams and across the organisation, enabling data-driven decision-making.
By leveraging Power BI's visualisation capabilities, users can transform raw data into compelling stories and actionable insights. The various visualisation types and customisation options ensure that patterns, trends, and comparisons within the data are effectively communicated. Interactivity enhances the user experience by enabling dynamic exploration and ad-hoc analysis. Sharing capabilities facilitate seamless collaboration and dissemination of insights. Ultimately, Power BI's visualisation features empower users to unlock the value of data and drive informed decision-making.
Generate visually interactive data models, by signing up for the Microsoft Power BI for End Users 55400AC Course now!
4) Sharing and Collaboration
Power BI facilitates seamless sharing and collaboration of insights. Users can easily publish and share dashboards and reports with others, whether by embedding them in websites or sharing them as interactive reports. The exchange enables teams and organisations to collaborate effectively, ensuring that the correct information reaches the stakeholders at the right time. The sharing capabilities of Power BI promote real-time data-driven decision-making and foster a culture of collaboration and knowledge exchange.
With Power BI, users can collaborate on shared data models and reports, enabling multiple team members to collaborate on Data Analysis and Visualisation projects. Power BI supports simultaneous editing and version control, ensuring that everyone is working on the latest and most accurate information. Users can leave comments, tag team members, and engage in discussions within the Power BI service, promoting collaboration and fostering a collaborative environment where insights and ideas can be shared, refined, and acted upon. Power BI's sharing and collaboration features enable teams and organisations to harness collective intelligence and expertise, driving better business outcomes.
5) Refreshing Data From SQL Server
Power BI allows for the seamless refreshing of data from SQL Server. Once the connection between Power BI and SQL Server is established, users can set up scheduled refreshes to ensure that the data in Power BI stays up to date. This automated process eliminates the need for manual data updates and ensures that the insights and visualisations in Power BI reflect the latest information from the SQL Server database. Users can define the frequency and timing of the data refreshes based on their specific requirements.
During the data refresh, Power BI retrieves the updated data from the SQL Server database and updates the corresponding datasets, reports, and dashboards in Power BI. The retrieval ensures that users can access and analyse the most recent data without any manual intervention. Refreshing data from SQL Server in Power BI enables organisations to make better informed decisions based on the most current and accurate data, enhancing the value and relevance of their analytics efforts.
6) Best Practices and Performance Optimisation
Best practices and performance optimisation are vital considerations when working with SQL Server and Power BI. It is essential to design a well-structured and normalised SQL Server database schema, implement indexing for efficient data retrieval, and optimise query performance. In Power BI, optimising data models by removing unnecessary elements, utilising calculated columns, and employing query folding techniques can enhance report and dashboard loading times.
Utilising DirectQuery or Live Connection mode, employing data compression and partitioning in SQL Server, and monitoring performance using tools like SQL Server Profiler and Power BI Performance Analyser are also effective strategies to improve system performance. By implementing these best practices, organisations can ensure efficient data access, faster report rendering, and enhanced performance in their SQL Server and Power BI environments.
Build a solid foundation in Database Management – register for our Introduction to SQL Training today!
What are the Best Practices for Connecting Power BI to SQL Server?
Before diving into the technical steps, it’s crucial to understand the best practices for connecting Power BI to SQL Server. Let’s explore those best practices:
1) Optimise Data Source
To ensure efficient and effective data analysis when connecting Power BI to SQL Server, follow these steps to optimise your data source:
a) Use Indexed Columns: Indexing columns in your database can enhance query performance and speed up data retrieval.
b) Leverage Stored Procedures: Instead of directly querying tables, use stored procedures to optimise data retrieval and enhance security.
c) Create Views: Views can simplify complex queries, improve data organisation, and boost overall performance.
d) Filter Data at the Source: Apply filters to your SQL queries to reduce the amount of data transferred to Power BI, thereby improving query performance.
e) Aggregate Data: Pre-aggregating data at the SQL Server level can optimise query performance by reducing the amount of data processed and transferred.
2) Use DirectQuery Mode
When connecting Power BI to SQL Server, using DirectQuery mode provides numerous benefits. To implement this mode, follow these steps:
a) Install Power BI Desktop
b) Connect to SQL Server
c) Choose the desired data source and database
d) Select the appropriate tables and views to include
e) Transform and clean the data as necessary
f) Create visualisations using the data
3) Utilise SQL Server Views
To utilise SQL Server views in Power BI, follow these steps:
a) Create a SQL Server view that contains the desired data and logic
b) In Power BI, click on “Get Data” and select the appropriate SQL Server connection
c) Choose the database that contains the view
d) Select the view from the list of available tables and views
e) Apply any necessary transformations and cleaning to the data
f) Create visualisations and reports using the view as the data source
4) Schedule Data Refresh
To schedule a data refresh in Power BI, follow these steps:
a) Open Power BI Desktop and go to the “Home” tab
b) Click on “Transform data” to open the Power Query Editor
c) In the Power Query Editor, make any necessary transformations and cleaning steps.
d) Once the data is prepared, click on “Close & Apply” to load it into Power BI
e) Visit the “File” menu and choose “Options and settings” and then “Data Source Settings”.
f) In the “Data Source Settings” window, click on the data source that requires a scheduled refresh.
g) Click on “Schedule…” and set the desired refresh frequency and time
h) Click “OK” to save the changes and close the window
i) Finally, publish your report to the Power BI service to enable the scheduled data refresh.
5) Secure Data Access
To ensure secure data access when connecting Power BI to SQL Server, follow these steps:
1) Implement robust authentication protocols, such as Windows authentication or Azure Active Directory.
2) Encrypt data transmission between Power BI and SQL Server using SSL/TLS protocols.
3) Restrict user access to SQL Server by assigning appropriate permissions based on roles and responsibilities.
4) Regularly update and patch SQL Server to address any security vulnerabilities.
5) Monitor and audit SQL Server activity to detect and respond to any unauthorised or suspicious access attempts.
Conclusion
Connecting Power BI to SQL unlocks real-time data insights and interactive visualisations. By following the steps here, you can seamlessly integrate these powerful tools to enhance your data analysis capabilities. Harness its power to streamline your data processes and drive more informed decisions within your organisation.
Take your skills to the next level with our Advanced SQL Training – join us now and unlock your full potential!
Frequently Asked Questions
How Does Power BI Utilise SQL Databases?

Power BI integrates with SQL Databases by connecting directly to them, enabling users to retrieve and visualise data. It allows real-time data querying, ensuring the latest information is displayed in reports and dashboards.
What are Some Common SQL-related Tasks Performed in Power BI?

Common SQL-related tasks in Power BI include writing queries for data extraction, creating relationships between tables, performing joins, filtering data, and optimising data models for more efficient reporting.
What is Knowledge Pass, and How Does it Work?

The Knowledge Academy’s Knowledge Pass, a prepaid voucher, adds another layer of flexibility, allowing course bookings over a 12-month period. Join us on a journey where education knows no bounds.
What are the Related Courses and Blogs Provided by The Knowledge Academy?

The Knowledge Academy offers various SQL courses, including Introduction to SQL and Advanced SQL. These courses cater to different skill levels, providing comprehensive insights into Basic and Advanced SQL Functions.
Our Programming and DevOps blogs cover a range of topics related to SQL, offering valuable resources, best practices, and industry insights. Whether you are a beginner or looking to advance your SQL Database Management skills, The Knowledge Academy's diverse courses and informative blogs have you covered.
What are the Other Resources Provided by The Knowledge Academy?

The Knowledge Academy takes global learning to new heights, offering over 3,000 online courses across 490+ locations in 190+ countries. This expansive reach ensures accessibility and convenience for learners worldwide.
Alongside our diverse Online Course Catalogue, encompassing 19 major categories, we go the extra mile by providing a plethora of free educational Online Resources like News updates, Blogs, videos, webinars, and interview questions. Tailoring learning experiences further, professionals can maximise value with customisable Course Bundles of TKA.
Upcoming Programming & DevOps Resources Batches & Dates
Date
 Introduction to SQL
Fri 7th Mar 2025
Fri 23rd May 2025
Fri 18th Jul 2025
Fri 12th Sep 2025
Fri 14th Nov 2025
Fri 12th Dec 2025


 Top Rated Course


 If you wish to make any changes to your course, please


