


 Top Rated Course

We may not have the course you’re looking for. If you enquire or give us a call on +971 8000311193 and speak to our training experts, we may still be able to help with your training requirements.
Top Kubernetes Monitoring Tools You Need to Know
Sienna Roberts 19 September 2023Explore the landscape of Kubernetes Monitoring with our comprehensive blog to the top tools. This blog offers insights into their functionalities and benefits, equipping you with the knowledge to ensure efficient and seamless container orchestration. Let's explore the key features of each tool, and how they contribute to streamlined management and enhanced performance.

Training Outcomes Within Your Budget!
We ensure quality, budget-alignment, and timely delivery by our expert instructors.
Table of Contents

Kubernetes Monitoring Tools help you keep an eye on how your applications are performing. They tell you if things are working well or if problems are about to happen. By using these tools, you can fix issues quickly, making sure your applications run smoothly.
If something seems off, these tools let you know so you can fix it and keep your apps in top shape. They help you catch glitches before they turn into big problems so your digital world keeps running smoothly. In this blog, we will discuss some of the best monitoring tools for Kubernetes to overcome the noticeable challenges of your applications.
Table of Contents
1) What is Kubernetes?
2) What are Kubernetes Monitoring Tools?
3) Why is monitoring essential?
4) What to monitor?
5) Top Kubernetes Monitoring ToolsDisadvantage of Kubernetes Tools
6) Comparison Table of Kubernetes Tools
7) Conclusion
What is Kubernetes?
Kubernetes, often referred to as K8s, is a widely adopted open-source container orchestration platform that revolutionises modern application deployment. It excels in automating the management and scaling of containerised applications, making it a go-to solution for diverse environments. Kubernetes simplifies application containerisation, allowing developers to transcend infrastructure intricacies and concentrate on seamless application development and scaling.
What are Kubernetes Monitoring Tools?
Kubernetes Monitoring Tools are essential for keeping an eye on your containerised applications and clusters. These tools serve several crucial purposes. They help maintain application reliability by tracking performance in real time and resolving issues promptly.
Security monitoring is another vital aspect, as these tools keep your applications secure by monitoring and enforcing security policies. Moreover, they play a role in cost management by tracking resource usage and optimising expenses.
Keen on gaining in depth knowledge about Kubernetes, refer to our blog on "Kubernetes Architecture"
Why monitoring is essential
Monitoring is fundamental for maintaining a robust, high-performing, and secure Kubernetes environment. Below are the expanded reasons detailing the importance of using monitoring tools for Kubernetes.
a) Quick issue identification: When you have real-time monitoring, you're instantly aware of issues. An alert could notify you of a pod failing or a service being unavailable. Immediate identification helps in faster resolution, reducing the impact on your operations.
b) Resource optimisation: Knowing how much CPU, memory, or storage is in use can be a game-changer. Kubernetes Monitoring Tools can alert you about overused or underused resources. This can guide you to redistribute resources efficiently, making sure nothing is wasted or bottlenecked.
c) User experience: User experience can have a great impact on your application. Monitoring ensures that all services are up and running. When your system is reliable, users are happy. Happy users stay loyal to your application.
d) Performance insights: Monitoring tools can track key performance indicators (KPIs). These KPIs might include request latency, error rates, or transaction times. Having this data at your fingertips helps you make informed decisions on what to optimise next.
e) Security: Security is a top concern in today's digital world. Monitoring tools can flag abnormal behavior. For instance, a sudden spike in traffic could indicate a DDoS attack. Early detection is key to preventing potential security incidents.
f) Trend analysis: Monitoring data collected over time is valuable for trend analysis. For instance, if your CPU usage peaks at certain times, you can prepare for it. This historical data aids in proactive planning and resource scaling.
g) Compliance auditing: In regulated industries like Healthcare or Finance, compliance is crucial. The Best Kubernetes Monitoring Tools can track whether you're meeting set standards. Regular reports can be generated for audits, ensuring that you're always in compliance.
h) Proactive troubleshooting: Monitoring isn't just for spotting issues; it’s also for preventing them. By studying trends and receiving alerts, you can tackle problems before they escalate. This proactive approach keeps your system running smoothly.
i) Cost efficiency: Monitoring can directly affect your bottom line. Over-provisioning resources is a common issue that can be costly. With proper monitoring, you can scale your resources down during low usage, thus saving money.
j) Developer productivity: Developers are more productive when they don’t have to put out fires. Monitoring helps by catching issues before they become critical. This allows developers to focus on what they do best: writing code and deploying features.
k) SLA adherence: You may have SLAs that promise certain uptimes or response times. Monitoring ensures you're keeping those promises. Any deviation can be corrected before it becomes a contractual issue.
l) Data-driven decisions: Monitoring provides hard data on how your system is performing. This empirical evidence is invaluable for making technical improvements and business decisions. No more guesswork; your strategies become data-driven.
m) A/B testing: If you're rolling out a new feature, monitoring can help track its impact. By comparing key metrics between different versions, you can decide which performs better. This makes A/B testing more accurate and valuable.
n) Visibility: Visibility into your system is beneficial for both technical and non-technical stakeholders. Real-time dashboards and reports make it easy to see how things are going at a glance. Transparency like this can improve team communication and decision-making.
Dive deep into container orchestration and elevate your career with Kubernetes Training for DevOps today!
What to monitor?
It’s crucial to have a comprehensive monitoring strategy in place for your Kubernetes clusters. Let’s break down the key aspects and metrics that should be part of your Kubernetes Monitoring solutions.
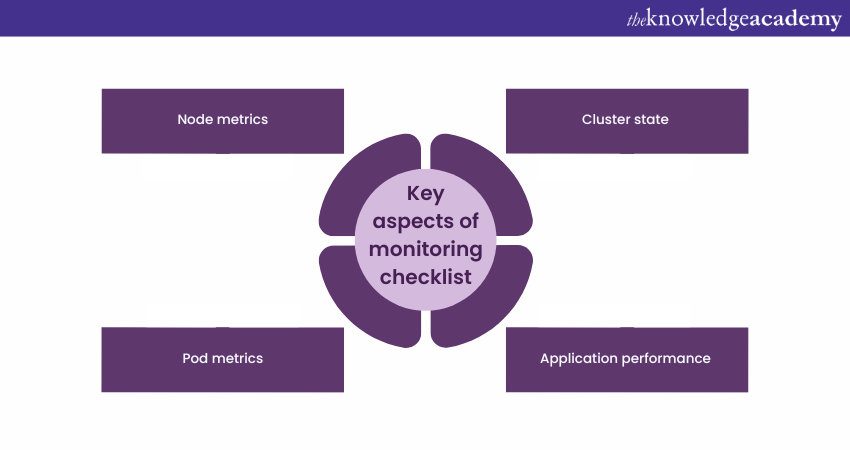
Node metrics
Nodes are the workhorses of your Kubernetes cluster. Monitoring them ensures that they are functioning optimally.
a) CPU usage: This is a fundamental metric. If CPU usage is consistently high, your nodes may be overloaded.
b) Memory usage: High memory usage can lead to swapping, which severely impacts performance.
c) Disk I/O: Disk input and output rates are crucial for applications that read and write data frequently.
d) Network I/O: This metric involves monitoring the data sent and received by the nodes. High network latency can lead to service delays.
Monitoring these metrics can help prevent nodes from becoming bottlenecks, ensuring smooth operation of your cluster.
Pod metrics
Pods are the basic deployable units in Kubernetes. Monitoring pod metrics helps in managing application performance.
a) CPU utilisation: This is the amount of CPU used by a pod. It's important to ensure that a pod is not consuming resources excessively.
b) Memory utilisation: This metric indicates how much memory a pod is using. Monitoring this can prevent out-of-memory errors.
c) Disk usage: This involves tracking the storage used by a pod. Some pods may need more storage, and monitoring helps in proper allocation.
d) Network traffic: This involves tracking the amount of data sent and received by a pod. High network traffic can indicate a bottleneck.
Cluster state
The cluster state provides a bird's eye view of the entire Kubernetes cluster. It is one of the best tools for monitoring resources in Kubernetes. Let’s take a look at its key features:
a) API Server availability: The API server is the entry point for commands. Its availability is crucial for the control plane.
b) Node status: This involves monitoring whether nodes are in the Ready, OutOfDisk, or other states.
c) Pod status: This includes checking whether pods are in the Running, Pending, or Failed states.
Application performance
Application performance metrics help ensure that the applications running on the Kubernetes cluster are performing optimally.
a) Response times: This involves tracking the time it takes to respond to a request.
b) Error rates: This involves monitoring the rate of requests that result in an error.
c) Throughput: This is the number of requests that the application processes in a specific time frame.
Top Kubernetes Monitoring Tools
When it comes to Kubernetes, having the right monitoring tools is vital for ensuring the system's health and performance. Here's a rundown of the best Kubernetes Monitoring Tools for Kubernetes.
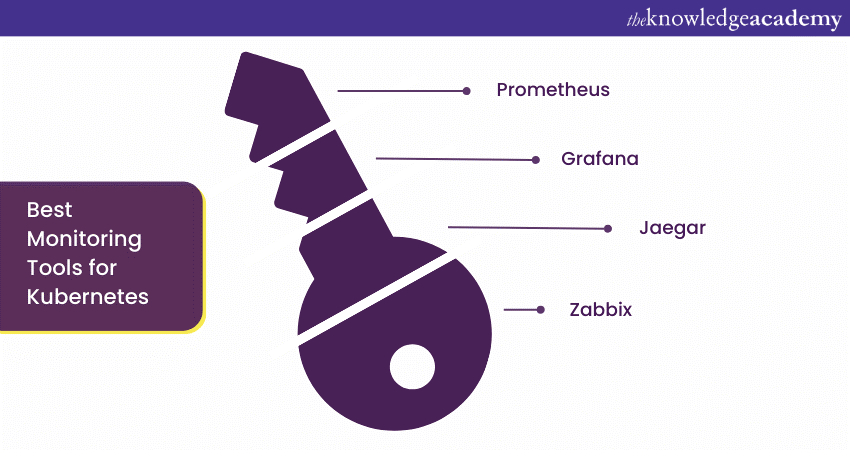
Prometheus
Prometheus is highly favoured in the Kubernetes ecosystem. It is one of the best monitoring tools for Kubernetes. Let’s explore its key features:
a) Real-time monitoring: It scrapes metrics at specified intervals. This provides real-time insight into system health.
b) Query language: PromQL allows you to perform complex queries. This feature is vital for deep data analysis.
c) Integration: Prometheus has native support for Kubernetes. This means easy setup and robust data collection.
d) Alerting: You can configure alerts based on specific conditions. Notifications are sent through different channels like email or Slack.
e) Scalability: It easily handles both small and large clusters. This makes it versatile for any setup.
f) Community support: A strong community backs Prometheus. Regular updates and extensive documentation are available.
g) Exporter feature: Custom exporters let you monitor various services. It can even track non-standard applications.
h) Storage: Time-series database storage is a feature. This format is great for real-time monitoring.
i) Alert manager: This subsystem allows complex alert configurations. It integrates well with most notification services.
j) Visualisations: While it doesn't rival Grafana, Prometheus does offer basic visualisations. This is useful for quick checks.
Grafana
Grafana is one of the go-to tools for monitoring resources in Kubernetes for many people due to its visualisation capabilities. Let’s take a look at some of its key features:
a) Custom dashboards: You can visualise your data in various formats. Choose from graphs, histograms, and more.
b) Alerting: Grafana enables you to set up alerts on your dashboards. You’ll be notified when metrics hit certain thresholds.
c) Plug-ins: It supports a wide range of data sources. You can even integrate it with Prometheus for more comprehensive metrics.
d) Data sources: Multiple data sources are supported. You can integrate databases, Prometheus, and more.
e) Templates: Pre-built dashboard templates are available. They accelerate the monitoring setup process.
f) Annotations: Graph annotations add context to your metrics. They can help during incident retrospectives.
g) Community plugins: A variety of community plugins are available. These extend Grafana’s core functionality.
h) User management: Granular user permissions are available. This helps in role-based access management.
i) Alerting: Grafana's alerting feature complements Prometheus. It offers flexible notification channels.
Jaeger
Jaeger is excellent for microservices architecture.
a) Distributed tracing: This feature is crucial for microservices. It helps you trace requests across various services.
b) Root cause analysis: Quickly identify where issues occur. This is helpful for resolving issues in complex distributed systems.
c) Performance optimisation: Jaeger can help you identify bottlenecks. Use this data to optimise your applications.
d) Data collection: Its agent-based model allows detailed monitoring. Agents collect metrics directly from services.
e) Scripting: Custom scripts offer specialised monitoring. This enables unique monitoring scenarios.
f) Visualisations: Multiple types of graphs and charts are available. This allows for customisable dashboards.
g) User roles: Role-based access control is a feature. It ensures that team members see relevant data.
h) Inventory management: Zabbix helps you keep track of all monitored elements. This is useful for large deployments.
i) Multi-tenancy: It supports multiple isolated users on a single instance. This is beneficial for larger teams.
Zabbix
Zabbix is ideal for large and complex systems.
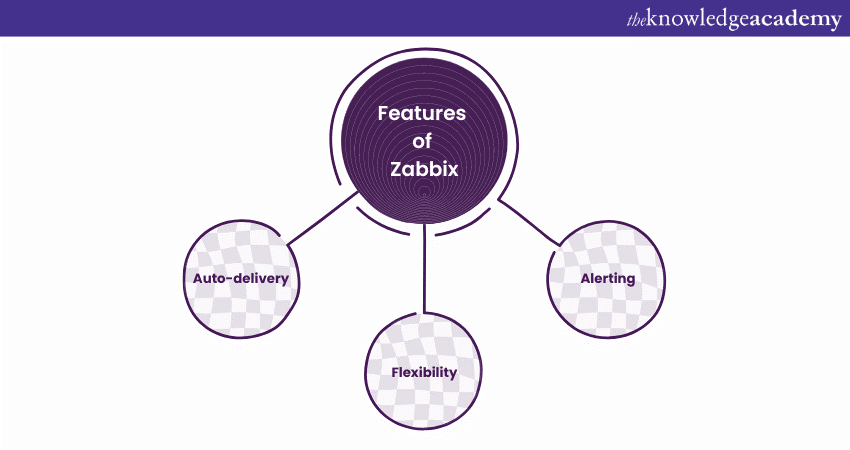
a) Auto-discovery: It automatically identifies new elements in your system. This saves time on manual configuration.
b) Flexibility: From simple metrics like CPU usage to custom metrics, Zabbix can handle it all.
c) Alerting: Custom alerts can be set up easily. You can get notifications through SMS, email, or even custom scripts.
Datadog
Datadog offers a full-stack monitoring solution.
a) Integration: It has out-of-the-box Kubernetes support. Integrating Datadog is simple and straightforward.
b) Custom metrics: You can define metrics that are specific to your use case. This enables more focused monitoring.
c) Dashboard: The Datadog dashboard is intuitive. It makes real-time monitoring easier for all team members.
New Relic
New Relic provides comprehensive application monitoring.
a) APM features: Advanced Application Performance Monitoring is available. This includes error tracking and user monitoring.
b) Real-time analytics: New Relic gives you real-time analytics. Make data-driven decisions more effectively.
c) Custom dashboards: Design dashboards to show the metrics that matter most to you. This allows for targeted monitoring.
Sysdig
Sysdig has both commercial and open source offerings.
a) Security features: Sysdig is known for its focus on security. Monitor for suspicious activity and potential breaches.
b) Container insights: Get in-depth metrics for your containers. This is vital for optimising container performance.
c) Easy to use: The Sysdig interface is user-friendly. This makes it accessible even for those new to Kubernetes monitoring.
InfluxDB
InfluxDB is focused on time-series data storage.
a) Time-series data: Specialisation in this data type makes it ideal for monitoring. It's excellent for tracking metrics over time.
b) Data retention policies: Storage management is easier with these policies. You can automatically delete older data.
c) Continuous queries: These provide real-time analytics. They can run in the background without affecting performance.
d) High availability: Redundancy and high availability are built in. This ensures that data loss risks are minimised.
e) Scalability: Designed to scale horisontally, it can grow with your cluster. This is useful for expanding setups.

Fluentd
Fluentd excels in log aggregation and data routing.
a) Data routing: It can route logs to multiple destinations. This includes databases and cloud storage solutions.
b) Plug-and-play architecture: This feature allows easy integrations. Fluentd works well with various data sources.
c) Community support: The open-source community actively contributes to Fluentd. This assures future updates and features.
d) Data transformation: You can modify and filter data as it gets processed. This enables more sophisticated data analytics.
e) Reliability: Fluentd has a robust buffering mechanism. This prevents data loss during transient network issues.
Dynatrace
Dynatrace is a comprehensive observability platform for monitoring the performance of applications and infrastructure in real time. It is one of the best Kubernetes Monitoring Tools, and let's explore its key features:
1) Offers end-to-end visibility into applications, services, and supporting infrastructure.
2) Utilises artificial intelligence for automatic anomaly detection and root cause analysis.
3) Ensures proactive identification and resolution of performance issues, reducing downtime.
4) Provides deep insights into user experiences and application dependencies.
5) Supports multi-cloud environments, microservices, and containerised applications.
6) Offers customisable dashboards and reports for tailored performance analysis.
7) Facilitates collaboration across DevOps and IT teams for faster issue resolution.
8) Empowers businesses with the ability to deliver high-performing, reliable digital experiences to users.
Sensu
Sensu provides an end-to-end observability pipeline, allowing you to collect, filter, and transform monitoring events and send them to your preferred database. Here's how Sensu enhances your monitoring experience:
1) Kubernetes compatibility: Sensu seamlessly operates within your Kubernetes cluster. It can coexist with Prometheus, offering a comprehensive solution for monitoring.
2) Simplified application metrics: Deploying Sensu as a DaemonSet alongside Prometheus is an efficient choice. It eliminates the need to integrate the Prometheus SDK into your application codebase and expose a metrics endpoint. Instead, the Sensu agent, working as a sidecar, continuously collects and exposes metrics to the Prometheus server.
3) Comprehensive metrics: Sensu provides various metrics, including system metrics like CPU, memory, and disk usage. You can also access custom application metrics and logs, which can be conveniently directed to your chosen database.
Sensu's approach simplifies and streamlines Kubernetes monitoring, saving you from the complexities of altering your application codebase and ensuring a hassle-free monitoring experience.
cAdvisor
cAdvisor, or Container Advisor, is an open-source monitoring agent with a primary focus on collecting and exporting resource usage and performance data from containers. Notably, it is an integral part of Kubernetes, tightly integrated into the Kubelet binary. It is considered one of the best Kubernetes Monitoring Tools on the market. Here are some key aspects of cAdvisor:
1) Node-level deployment: Unlike many other monitoring agents that operate at the pod level, cAdvisor functions at the node level. This means it automatically identifies and tracks all containers running on a specific machine, effectively capturing essential system metrics like memory, CPU, and network usage.
2) Simplicity and integration: cAdvisor is favoured for its simplicity and user-friendliness. It effortlessly exposes Prometheus metrics by default, making it an easily accessible monitoring tool. However, it's important to note that cAdvisor, while straightforward, might lack the comprehensive features needed for a comprehensive monitoring solution in complex or enterprise-level environments.
cAdvisor's niche is in offering basic Kubernetes-native container monitoring capabilities. It may be the right choice for simpler setups, thanks to its straightforward integration with Prometheus. Still, for more extensive and demanding monitoring requirements, organisations may need to complement it with additional monitoring solutions.
Kube-state-metrics
Kube-state-metrics, a Kubernetes-native metrics service, operates by monitoring the Kubernetes API and generating metrics that provide insights into various objects like pods, services, deployments, nodes, and more. These metrics are readily available for consumption on the metrics HTTP endpoint in a plain text format. This makes them accessible and easily scrapable for users, especially those who employ Prometheus for monitoring purposes.
While kube-state-metrics simplifies the collection of Kubernetes metrics, it is just one part of a complete monitoring solution for Kubernetes. It would need additional components to form a comprehensive monitoring system. Let's explore some of its key features:
1) Kubernetes-native metrics: Kube-state-metrics is tailored to generate metrics that reflect the state and status of various Kubernetes objects, making it an ideal choice for Kubernetes environments.
2) Prometheus integration: The metrics generated by kube-state metrics are designed to be seamlessly integrated with Prometheus, enabling straightforward consumption and scraping.
3) Easy access: Metrics are easily accessible through the /metrics HTTP endpoint in plaintext format, allowing for straightforward monitoring and analysis.
4) Complementary component: Kube-state-metrics serves as a valuable component in a complete Kubernetes monitoring solution but is typically used alongside other tools to create a comprehensive system.
5) Insights into Kubernetes objects: The service provides metrics related to different Kubernetes objects, helping users gain in-depth visibility into their cluster's health and performance.
Comparison Table
A comparison table can help you quickly evaluate open-source monitoring tools for Kubernetes. Below, we compare key features to aid your decision-making.
Features to Compare
a) Data collection: How the tool gathers metrics.
b) Alerting capabilities: Types of alerts you can configure.
c) Data storage: Where and how data gets stored.
d) Visualisations: The range of data presentation options.
e) Community support: Level of community activity and updates.
f) Scalability: How well the tool can grow with your setup.
g) Customisation: How easily you can adapt the tool to your needs.
Comparison Table
|
Feature |
Prometheus |
Grafana |
Zabbix |
InfluxDB |
Fluentd |
|
Data collection |
Real-time |
N/A |
Agent-based |
Real-time |
Real-time |
|
Alerting |
Yes |
Yes |
Yes |
No |
No |
|
Data storage |
Time-series DB |
N/A |
SQL DB |
Time-series DB |
Extensible |
|
Visualisations |
Basic |
Advanced |
Moderate |
Basic |
None |
|
Community support |
High |
High |
Moderate |
High |
High |
|
Scalability |
High |
High |
High |
High |
Moderate |
|
Customisation |
High |
High |
High |
Moderate |
High |
Disadvantage of Kubernetes Tools
One common downside of Kubernetes Monitoring Tools is the complexity involved in setting them up and maintaining them. These tools often have a challenging learning curve. New users may find it difficult to navigate through extensive features, configurations, and integrations. Even with well-documented tools like Prometheus, a beginner can easily get overwhelmed. The initial setup, which often involves multiple components, can be intricate.
Another issue is resource consumption. Monitoring tools, especially when improperly configured, can be resource-intensive. They might consume significant amounts of CPU and memory. This is particularly true for large-scale deployments.
For example, storing extensive historical data in time-series databases can quickly use up storage space. High resource consumption could lead to increased operational costs and even impact the performance of the applications you're monitoring.
The rapid pace of development in the Kubernetes ecosystem presents a challenge. Kubernetes Monitoring Tools need constant updates to be compatible with the latest Kubernetes features and APIs.
Users have to keep up with these changes, which can be frequent. Even open source tools with strong community support may lag in updating features or fixing compatibility issues. This creates an additional layer of maintenance that organisations need to manage.
Conclusion
Kubernetes Monitoring Tools help you catch problems before they mess things up. They give you the information you need to make smart decisions, so your applications stay up and running well. It's like having a helpful co-pilot who's always looking out for you.
Elevate your AWS skills to the next level by mastering container orchestration with Running Containers on Amazon Elastic Kubernetes Service (EKS) Training!
Frequently Asked Questions
Upcoming Programming & DevOps Resources Batches & Dates
Date
 Kubernetes Training
Kubernetes Training
Fri 14th Feb 2025
Kubernetes Training
Fri 11th Apr 2025
Kubernetes Training
Fri 13th Jun 2025
Kubernetes Training
Fri 15th Aug 2025
Kubernetes Training
Fri 10th Oct 2025
Kubernetes Training
Fri 12th Dec 2025
 If you wish to make any changes to your course, please


