


 Top Rated Course

We may not have the course you’re looking for. If you enquire or give us a call on +44 1344 203999 and speak to our training experts, we may still be able to help with your training requirements.
Top 15 Data Science Projects: Beginner to Expert level
Eliza Taylor 27 February 2025Are you eager to explore trending projects related to Data Science? This blog covers all the Data Science Projects from beginner to professional levels to help you leverage the full potential of this trending career path. Whether you are a learner or a professional, this blog is a must-read to fuel your professional growth!
Training Outcomes Within Your Budget!
We ensure quality, budget-alignment, and timely delivery by our expert instructors.
Imagine a vast landscape where raw data holds the keys to unlocking hidden insights, predicting trends, and making impactful decisions. Whether you’re a curious beginner or a seasoned professional, this blog is your compass, guiding you toward fascinating Data Science Projects for igniting your passion and expanding your skill set.
This pathway has something for everyone. From playful explorations to complex challenges, we’ve got you covered. Let’s dive into this curated collection of Data Science Projects and start shaping your Data Science journey today!
Table of Contents
1) What is Data Science?
2) Why Build Data Science Projects?
3) Beginner-level Data Science Projects
4) Intermediate-level Data Science Projects
5) Advanced-level Data Science Projects
6) Conclusion
What is Data Science?
Data Science is an interdisciplinary discipline that utilises the applications of Mathematics, Statistics, and Computer Science subjects to mine insights from data and influence a multitude of industries. The trending topic revolves around the application of Algorithms, scientific methods, and Machine Learning (ML) systems to derive practical knowledge from data, whether Structured, Semi-structured, Or Unstructured.
The concept of Data Science begins with a simple data analysis that converts intricate data into comprehensible insights for strategic decisions. For this, Data Scientists employ Statistical techniques and Machine Learning (ML) to predict outcomes and inform actions across various sectors. These include healthcare, finance, marketing, environmental science, and sports.

Why Build Data Science Projects?
Engaging in Data Science Projects is essential for both beginners and seasoned professionals aiming to deepen their data-related conceptual understanding and showcase their expertise. These projects offer practical experience, which allows individuals to apply theoretical knowledge to real-world scenarios. Here are the reasons to build Data Science Projects:
1) Hands-On Experience: Projects provide practical exposure, enabling theoretical and conceptual applications related to real-world data. This hands-on approach further solidifies understanding of Data Analysis and enhances problem-solving abilities.
2) Skill Development: Working on various projects helps in mastering different tools, technologies, and methodologies that are prevalent in the Data Science field. This continuous learning process is vital for staying updated with industry advancements.
3) Portfolio Enhancement: A diverse project portfolio showcases your capabilities to potential employers. This demonstrates your ability to tackle complex data challenges and deliver actionable insights.
4) Understanding Real-World Applications: Projects bridge the gap between academic learning and industry requirements. This approach provides actionable insights into how Data Science solutions are implemented to solve real-life business problems.
5) Networking Opportunities: Collaborating on projects can lead to cross-professional connections alongside other experts in the field. This fosters knowledge exchange and levels up the potential career opportunities.
Beginner-level Data Science Projects
For the freshers in the Data Science field, these Data Science Projects will be highly useful. The following are some of the most popular Beginner Data Science Projects described in detail:
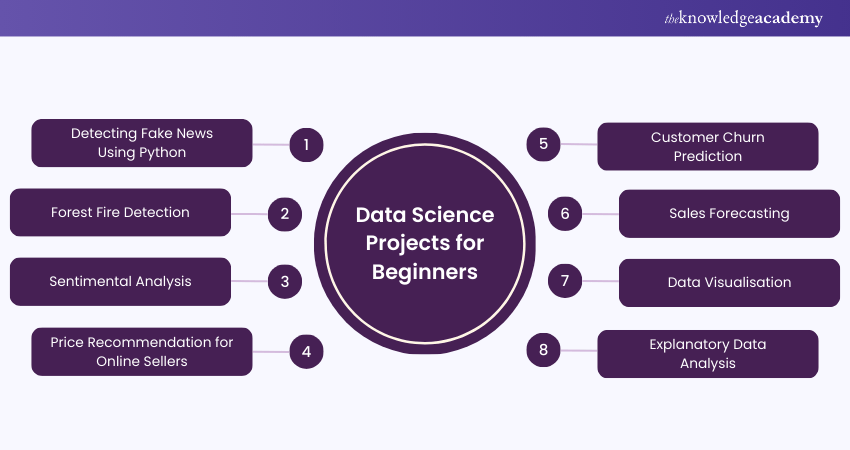
1) Detecting Fake News Using Python
Detecting fake news using Python is a fascinating Data Science Project that employs the applications of Machine Learning and Natural Language Processing (NLP) to identify whether a news item is genuine or fake. Here's a step-by-step overview of it:
a) Data Collection: Begin by obtaining a dataset that comprises news articles along with their labelled classifications as 'True' or 'Fake'. The dataset should contain a mix of both types for balanced learning.
b) Data Pre-processing: When you have the news article, start to cleanse the text data. This typically includes removing additional special characters by converting them to lowercase and applying Stemming or Lemmatisation principles. You may also convert the text into a numerical form, such as Bag of Words or TF-IDF vectors.
c) Exploratory Data Analysis: Analyse the dataset to identify hidden patterns and correlations that could inform the model choice and used features.
d) Model Selection: Choose a suitable Machine Learning model. Algorithms such as Naive Bayes, Logistic Regression, or Support Vector Machines are commonly used for this task.
e) Model Training: Train the model using the pre-processed data and Cross-validation, among other key techniques, to ensure robustness.
f) Performance Evaluation: Evaluate the model's performance using appropriate metrics such as Precision, Recall, And F1-score.
g) Model Optimisation: Improve the model's performance by Fine-tuning parameters or using more complex models or techniques.
h) Deployment: Implement the model into a real-life application, such as a Browser Plugin that warns users about potential fake news.
2) Forest Fire Detection
Forest Fire Detection is a significant Data Science Project that utilises Machine Learning to predict the possibility of a forest fire, aiding in early detection and the prevention of catastrophic results. Here's a step-by-step overview of how to perform this project:
a) Data Collection: Obtain a dataset that includes factors affecting forest fires, such as Temperature, Humidity, Wind Speed, and so on. Using the UCI Machine Learning Repository's Forest Fire dataset can be a good starting point.
b) Data Pre-processing: Cleanse and normalise the data to ensure uniform interpretation using the Machine Learning model.
c) Exploratory Data Analysis: Analyse the dataset to identify hidden trends, correlations, and predictive features of forest fires.
d) Model Selection: Choose a suitable Machine Learning model. Common choices for this task include Decision Trees, Random Forests, or Gradient Boosting.
e) Model Training: Train your model using the pre-processed dataset and apply cross-validation for robustness.
f) Performance Evaluation: Evaluate the model's performance using suitable metrics such as accuracy, precision, recall, and Mean Squared Error (MSE).
g) Model Optimisation: Enhance the model's performance by fine-tuning parameters or using Ensemble techniques.
h) Deployment: Implement the model into a real-world system to provide early warnings for potential forest fires.
Learn to derive meaningful information from raw data by signing up for our Natural Language Processing (NLP) Fundamentals with Python Course now!
3) Sentimental Analysis
Sentimental Analysis is an engaging Data Science Project that implements Natural Language Processing (NLP) and Machine Learning Algorithms to identify and pull out subjective information from source materials. Here's a step-by-step overview of how to perform this project:
a) Data Collection: Gather a dataset that contains text data along with their sentiment labels. This could be customer reviews, tweets, or any textual data that expresses sentiments.
b) Data Pre-processing: Clean the text data by removing special characters and stopwords and applying the Stemming or Lemmatisation principle. Then, convert the text data into numerical features using methods like Bag of Words or Team Frequency - Invert Document Frequency (TF-IDF).
c) Exploratory Data Analysis: Analyse the dataset to identify patterns and trends that might aid in sentiment prediction.
d) Model Selection: Utilise Machine Learning models such as Logistic Regression, Naive Bayes, and support vector machines. Alternatively, explore Deep Learning models like Recurrent Neural Networks (RNNs) and long-term memory (LSTMs).
e) Model Training: Train your chosen model on the pre-processed data.
f) Performance Evaluation: Evaluate the model's performance using appropriate metrics such as Precision, Recall, And F1-score.
g) Model Optimisation: Utilise Machine Learning models such as Naive Bayes, logistic regression, and support vector machines. Alternatively, explore Deep Learning models like Recurrent Neural Networks (RNNs) and long-term memory (LSTMs).
h) Deployment: Implement the model into a usable application, such as a tool that gauges customer sentiment from reviews or social media comments.
Transform your career with our Data Science with R Training – join us now for expert-led training sessions!
4) Price Recommendation for Online Sellers
Data-driven Pricing Recommendations for online vendors involve utilising advanced analytics to improve pricing strategies and enhance profitability and market position. Here’s how you can perform Price Recommendations for Online Sellers:
a) Data Acquisition: Collect pertinent data encompassing past sales, competitor pricing, customer profiles, and market movements.
b) Feature Development: Derive significant attributes from the data that spotlight product characteristics, purchase timing, and consumer activity trends.
c) Algorithm Selection: Identify suitable predictive models, such as Regression Analyses, Neural Networks, or Decision Trees, to forecast ideal pricing based on the extracted features.
d) Algorithm Training: Educate the chosen Algorithm with historical datasets to recognise patterns that dictate pricing strategies.
e) Strategic Pricing: Employ the trained Algorithm to suggest prices that consider aspects like market demand sensitivity, competitive behaviour, and profit objectives.
f) Performance Review and Refinement: Persistently assess the Algorithm’s accuracy and fine-tune the pricing tactics in response to ongoing data and market shifts.
5) Customer Churn Prediction
Forecasting Customer Attrition for a Telecom Enterprise involves leveraging Machine Learning and Predictive Analytics to identify customers who are likely to discontinue their service. The complete process includes:
a) Data Aggregation: Accumulate essential information such as user demographics, consumption habits, service records, and client interactions.
b) Feature Synthesis: Craft and extract pertinent attributes from the data, highlighting metrics like mean monthly usage, agreement specifics, client longevity, and grievance records.
c) Algorithm Choice: Select fitting Machine Learning Algorithms, including Logistic Regression, Decision Trees, Random Forests, Or Gradient Boosting methods.
d) Algorithm Education: Educate the chosen Algorithm with past data, employing cross-validation methods to confirm its strength.
e) Churn Prognostication: Deploy the educated Algorithm on current data to ascertain the likelihood of customer departure.
f) Strategic Interventions: Utilise the Algorithm’s insights to execute focused retention manoeuvres, offering customised deals or enhanced customer support.
6) Sales Forecasting
Sales Forecasting helps Data Scientists implement Machine Learning for sales prediction and develop more effective strategies to ensure inventory is well-managed and customer needs are consistently met. How is how you can perform this operation:
a) Data Assembly and Purification: Accumulate pertinent sales information from a variety of channels, verifying its precision and uniformity.
b) Investigative Data Scrutiny (IDS): Conduct a thorough examination of the data to discern trends, configurations, and interconnections that may influence future sales predictions.
c) Feature Crafting: Pinpoint and formulate significant attributes from the dataset that will enhance the predictive power of the forecasting models.
d) Model Identification and Development: Select the most fitting Data Science models, such as regression or time series analyses, and cultivate them with historical data.
7) Data Visualisation
This project concept revolves around the art of transforming data into visually striking and understandable formats such as charts, graphs, and dynamic dashboards. It empowers stakeholders to derive meaningful insights and make informed decisions rooted in data. Here’s a streamlined guide:
a) Data Investigation: Initiate by delving into your data to grasp its essence via summary metrics, distribution analyses, and correlation studies.
b) Critical Variable Identification: Pinpoint the most significant variables that align with your visualisation objectives to sharpen your analysis focus.
c) Designing Visualisations: Select the most fitting visual formats like graphs, charts, or maps that best represent your data and the insights you aim to highlight.
d) Data Analysis: Employ statistical or Machine Learning techniques to uncover trends or connections that can elevate the impact of your visualisations.
e) Interactive Display: Craft engaging and insightful visualisations that enable stakeholders to intuitively navigate through data patterns and trends.
8) Explanatory Data Analysis
Exploratory Data Analysis (EDA) is the process of analysing and visualising data to understand its patterns, trends, and insights before analysis. It serves as the initial data analysis phase to understand your data complexities, which often involve visualisation techniques for enhanced examination. Let's look at it in more detail:
a) Data Acquisition: Begin by securing comprehensive and accurate datasets from reliable sources.
b) Data Refinement: Process the data to correct any missing values, anomalies, and discrepancies that could skew the analysis.
c) Exploratory Visualisation: Use a variety of graphs, charts, and plots to visually analyse and understand the data's patterns, trends, and relationships.
d) Statistical Summarisation: Utilise Descriptive Statistics and indicators to summarise the data and extract key insights.
e) Hypothesis Evaluation (when applicable): Develop and assess Hypotheses to validate assumptions and derive significant conclusions from the data.
Intermediate-level Data Science Projects
Engaging in intermediate-level Data Science Projects is a valuable way to enhance your understanding and skills in Data Science. Some of the most popular intermediate-level Data Science projects are detailed below:
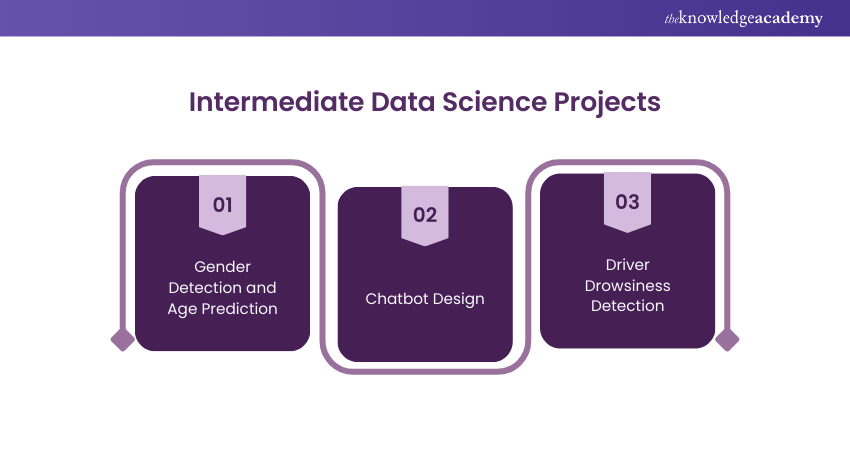
9) Gender Detection and Age Prediction Project
This project presents an exciting classification challenge that will put your Computer Vision skills and Machine Learning to the test. Here’s a step-by-step methodology on the ways to implement Gender Detection and Age Prediction project:
a) Understand Objective: Familiarise yourself with the goals of gender detection and age prediction and explore their practical applications.
b) Set Up Environment: Install Python libraries such as OpenCV, TensorFlow/Keras, and NumPy for image processing and model training.
c) Obtain Dataset: Use the Adience dataset, which contains diverse facial images categorised by age and gender, as your primary data source.
d) Pre-process Images: Resize images for uniformity, normalise pixel values, and apply augmentations to improve model robustness.
e) Handle Data Challenges: Address issues like variations in lighting, cosmetics, and expressions by carefully pre-processing and augmenting the dataset.
f) Build CNN Model: Design a Convolutional Neural Network to classify gender and predict age ranges.
g) Train and Evaluate Model: Train the CNN on the Adience dataset, validate its performance, and tune hyperparameters for better results.
h) Test on New Data: Use unseen images to evaluate the system’s accuracy in predicting age and gender.
i) Deploy Model: Implement the trained model in real-world applications or an interactive interface for live predictions.
j) Document Findings: Present a summary of the project, including challenges faced, improvements made, and performance metrics.
10) Chatbot Design
Chatbots are vital for businesses as they efficiently answer customer questions, provide information, and reduce the workload on customer support teams by automating routine tasks. Here’s a step-by-step overview of creating a Chatbot:
a) Understand Objective: Determine the purpose of the chatbot—whether it is domain-specific (e.g., for customer support) or open-domain (e.g., general conversations).
b) Set Up Environment: Install necessary Python libraries like TensorFlow, Keras, and NLTK to implement Machine Learning models.
c) Prepare Dataset: Use a JavaScript object notation (JSON) dataset with intents, sample queries, and responses to train the chatbot.
d) Pre-processed Data: Tokenise text, remove stop words, and encode inputs for training the Machine Learning model.
e) Build Neural Network: Create a Recurrent Neural Network (RNN) or Long Short-Term Memory (LSTM) model to process customer inputs and generate responses.
f) Train the Model: Train the model using the JSON dataset and fine-tune it for better accuracy.
g) Test the Chatbot: Test the chatbot with various queries to ensure it provides accurate and contextually relevant responses.
h) Deploy the Chatbot: Implement the chatbot in your desired platform, such as a mobile app, website, or messaging service.
i) Monitor and Improve: Continuously monitor the chatbot’s performance and update it with new data or improved Algorithms.
j) Document and Share: Summarise the chatbot’s functionality, usage, and benefits, and share insights for feedback or further improvement.
11) Driver Drowsiness Detection
This project aims to enhance road safety by developing a system that monitors a driver's eyes using a webcam to detect signs of fatigue or distraction. By identifying drowsiness in real-time, the system can alert drivers and potentially prevent accidents. Here’s how you can perform this project:
a) Understand Objective: Define the purpose of detecting driver fatigue and its significance in enhancing road safety.
b) Set Up Environment: Install Python libraries like OpenCV, TensorFlow, Keras, and Pygame for video processing and deep learning. Using OpenCV Functions alongside these libraries will allow you to effectively process images and videos, as well as implement advanced machine learning techniques.
c) Obtain Dataset: Use datasets with labelled images or videos of open and closed eyes to train the model.
d) Pre-process Video Input: Capture video frames from the webcam, resize them, and convert them to grayscale for efficient processing.
e) Build Deep Learning Model: Create a Convolutional Neural Network (CNN) to classify eye states (open or closed).
f) Train the Model: Train the model using pre-processed data and evaluate its performance for accuracy.
g) Implement Real-Time Detection: Integrate the trained model with a webcam feed to analyse eye states in real-time.
h) Set Alert Mechanism: Program the system to trigger audio or visual alerts when signs of drowsiness are detected.
i) Test the System: Evaluate the system under various conditions to ensure robustness and reliability.
j) Deploy and Optimise: Deploy the system for real-world use and fine-tune it for different lighting and environmental conditions.
Advanced-level Data Science Projects
The advanced-level Data Science Projects are meant for advanced-level professionals who are looking to level up their skills in the field of Data Science. Here are the advanced-level projects stated below
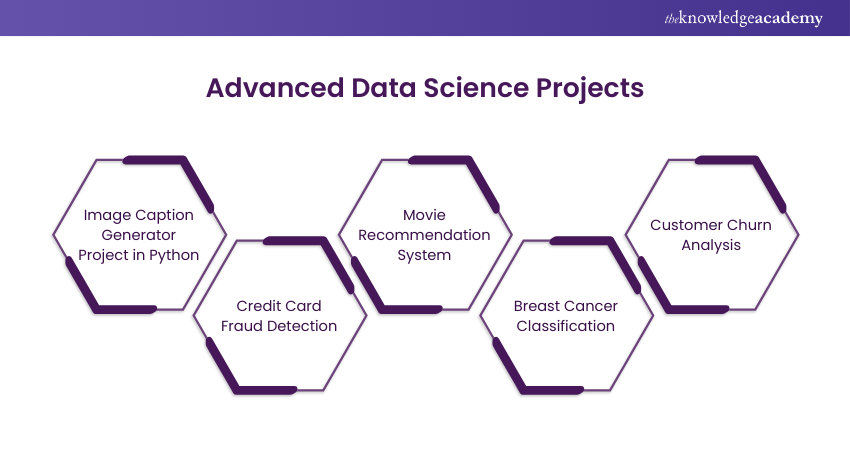
12) Image Caption Generator Project in Python
This is a fascinating Data Science Project. Humans can simply describe what they see in an image, but for computers, an image is just a matrix of numbers that indicate the colour value of each pixel. Below is a refined guide for creating an “Image Caption Generator Project in Python”:
a) Data Compilation: Assemble a collection of images paired with descriptive captions.
b) Data Processing: Carry out preprocessing tasks on both images and captions, which include resizing images for uniformity, breaking down captions into tokens, and constructing a comprehensive vocabulary.
c) Deep Learning Architecture: Look for a robust Deep Learning architecture, integrating a CNN (Convolutional Neural Network) for distilling image features and an LSTM (Long Short-Term Memory) network for generating the captions.
d) Model Training: Educate the model with the processed data to foster an understanding of the correlations between visual elements and their corresponding textual descriptions.
e) Model Assessment: Gauge the model’s effectiveness using evaluation metrics such as BLEU (Bilingual Evaluation Understudy) to determine the quality of the captions it generates.
f) Caption Generation: Deploy the trained model to craft coherent and pertinent captions for new images.
13) Credit Card Fraud Detection
This is one of the crucial Data Science Projects that apply Machine Learning Algorithms to identify fraudulent transactions. As a result, it helps increase the security of financial operations. Here's a step-by-step overview of the project:
a) Data Collection: Acquire a dataset that includes credit card transactions, both legitimate and fraudulent. Often, datasets like this are highly unbalanced due to the relatively rare occurrence of fraud.
b) Data Pre-processing: Cleanse the data, handle missing values and outliers, and normalise the features to ensure consistent data interpretation by the model.
c) Exploratory Data Analysis: Examine the data to identify trends, correlations, and features that are the most predictive of fraud.
d) Model Selection: Common choices for this type of task include Logistic Regression, Support Vector Machines, Random Forest, or Neural Networks.
e) Model Training: Train your model using the processed dataset. Given the unbalanced nature of the data, you might need to use techniques like oversampling or under-sampling.
f) Performance Evaluation: Assess the model's performance using relevant metrics like accuracy, precision, recall, F1-score, and AUC-ROC.
g) Model Optimisation: Improve the model by fine-tuning its parameters to increase its predictive performance.
h) Deployment: Implement the model into a practical application that can monitor transactions and alert the bank or user of any detected fraudulent activities that have been detected.
Transform your career with our Data Science with R Training – join us now for expert-led training sessions!
14) Movie Recommendation System
This project aims to create a movie recommender using R and Machine Learning techniques. A recommender system offers personalised suggestions to users based on the similarity of their tastes and behaviour with other users. For example, if A and B both enjoyed "The Lord of the Rings" and B also liked "Star Wars", the system might recommend Star Wars to A as well. This way, the system can increase user satisfaction and retention. Here's a sequential description of the project:
a) Data Collection: Gather a dataset containing user ratings for a variety of movies. Popular datasets for this purpose include the MovieLens and Netflix datasets.
b) Data Pre-processing: Clean the data by handling missing values and transforming data types if necessary. This step might also involve feature selection, where you identify relevant attributes to use in the recommendation Algorithm.
c) Exploratory Data Analysis: Analyse the data to identify patterns, trends and correlations. This can help in understanding the characteristics of the data and guide the model development process.
d) Model Selection: Choose a recommendation system approach. The two primary types are content-based filtering (recommendations based on similarities in item content) and collaborative filtering (recommendations based on similarities in user-item interactions).
e) Model Implementation: Implement the chosen model using a Machine Learning library. For Python, libraries like Scikit-learn and Surprise are often used.
f) Evaluation: Evaluate the model's performance using suitable metrics, such as Root Mean Squared Error, Precision@k, and Recall@k.
g) Model Optimisation: Fine-tune the model's parameters to improve its performance.
h) Deployment: Deploy the recommendation system in a user-friendly format, such as a web app or an integration with an existing platform.
15) Breast Cancer Classification
This project uses Python and the regular dataset to identify Invasive Ductal Carcinoma (IDC), the most prevalent type of breast cancer. It occurs when abnormal cells grow in a milk duct and spread to the surrounding tissue. The project applies Deep Learning and the Keras library to classify the images of tissues as either benign or malignant. Here's a step-by-step overview to the project:
a) Data Collection: Gather a dataset containing features of breast cancer cells along with their classification. The UCI Machine Learning Repository's Breast Cancer Wisconsin (Diagnostic) dataset is commonly used.
b) Data Pre-processing: Handle missing or inconsistent data and normalise the numerical features to a standard scale.
c) Exploratory Data Analysis: Perform Data Analysis to understand the correlation between different features and the classification outcome.
d) Model Selection: Choose a suitable model. Common choices for this task include Logistic Regression, Decision Trees, and Support Vector Machines.
e) Model Training: Train the chosen model using the processed dataset, employing cross-validation to ensure robustness.
f) Performance Evaluation: Evaluate the model's performance using appropriate metrics such as accuracy, precision, recall, F1-score, and AUC-ROC.
g) Model Optimisation: Fine-tune the model's parameters and consider ensemble techniques for improved performance.
h) Deployment: Implement the model in a practical application, such as an automated diagnostic tool.
Boost risk assessment with Predictive Analytics- Sign up for our Predictive Analytics Training today!
Conclusion
Data Science Projects offer a unique blend of theory and practical learning, serving as a launchpad for budding Data Scientists and an advancement platform for experts. They provide hands-on experience with real-world problems, paving the way for transformative solutions. For example, Face Detection with OpenCV Python is one such project that helps you develop essential computer vision skills while solving real-time problems. So, whether you're starting your Data Science journey or looking to fine-tune your skills, these Data Science Projects will undoubtedly enhance your portfolio and boost your marketability.
Learn to combine scientific techniques to extract information from data - Join our Data Science Analytics Course now!
Frequently Asked Questions
How Do You Get Ideas for Data Science Projects?
One way to get ideas for Data Science Projects is to explore datasets on platforms like Kaggle, UCI, or Google Dataset Search. You can also find problems or questions that interest you or have real-world impact. Another way is to read blogs, papers, or books on Data Science topics. You can also join online courses and webinars to enhance your knowledge.
How Do You Get Ideas for Data Science Projects?
To contribute to open-source Data Science Projects, you can fork or clone existing projects on GitHub or other platforms. You can then add new features, fix bugs, or improve documentation. You can further submit pull requests or issues to the original project owners. Finally, you can share your work with the community and get feedback.
What are the Other Resources Provided by The Knowledge Academy?
The Knowledge Academy takes global learning to new heights, offering over 3,000 online courses across 490+ locations in 190+ countries. This expansive reach ensures accessibility and convenience for learners worldwide.
Alongside our diverse Online Course Catalogue, encompassing 19 major categories, we go the extra mile by providing a plethora of free educational Online Resources like News updates, Blogs, videos, webinars, and interview questions. Tailoring learning experiences further, professionals can maximise value with customisable Course Bundles of TKA.
What is Knowledge Pass, and how Does it Work?
The Knowledge Academy’s Knowledge Pass, a prepaid voucher, adds another layer of flexibility, allowing course bookings over a 12-month period. Join us on a journey where education knows no bounds.
What are Related Data Science Courses and Blogs Provided by The Knowledge Academy?
The Knowledge Academy offers various Data Science Courses, including Advanced Data Science Certification, Data Science with R Training, and Predictive Analytics Course. These courses cater to different skill levels, providing comprehensive insights into the Hypothesis Testing: A Guide to Making Data-Driven Decisions.
Our Data Science Blogs covers a range of topics related to Data Science, offering valuable resources, best practices, and industry insights. Whether you are a beginner or looking to advance your Data Science skills, The Knowledge Academy's diverse courses and informative blogs have you covered.
Upcoming Programming & DevOps Resources Batches & Dates
Date
 Python Data Science Course
Python Data Science Course
Mon 21st Jul 2025
Python Data Science Course
Mon 8th Sep 2025
Python Data Science Course
Mon 24th Nov 2025
Python Data Science Course
Mon 8th Dec 2025
 If you wish to make any changes to your course, please


